2736
Proceedings of the 18
th
International Conference on Soil Mechanics and Geotechnical Engineering, Paris 2013
With introduction of a new section bearing a heavier load,
600 mm piles were also adopted, with load tests indicating a
permissible load of 1,800 kN. At this point, 1,569 stakes had
been planned for completion of the entire project. However, as a
result of the tests, and subsequent project design optimization
taking into account the increased loads, this number fell, in a
second step, to 1,275 (an 18% decrease in the number of
remaining piles). This decrease resulted in a direct cost
reduction of 1.62 million reais, not taking into account the
number of blocks needed, and also the indirect costs.
Considering the costs involved in performing the load tests, the
actual cost reduction amounted to 1.08 million reais.
The final total of all piles placed, both before and after the
revision, came to 3,838. A total of 38 (thirty-eight) static load
tests were programmed throughout the project, 27 (twenty
seven) for 500 mm piles, 9 (nine) for the 600 piles, and 2 (two)
for 400 mm piles. However, two of the load tests, specifically
the 33rd and 34th, indicated problems in the pile caps, and had
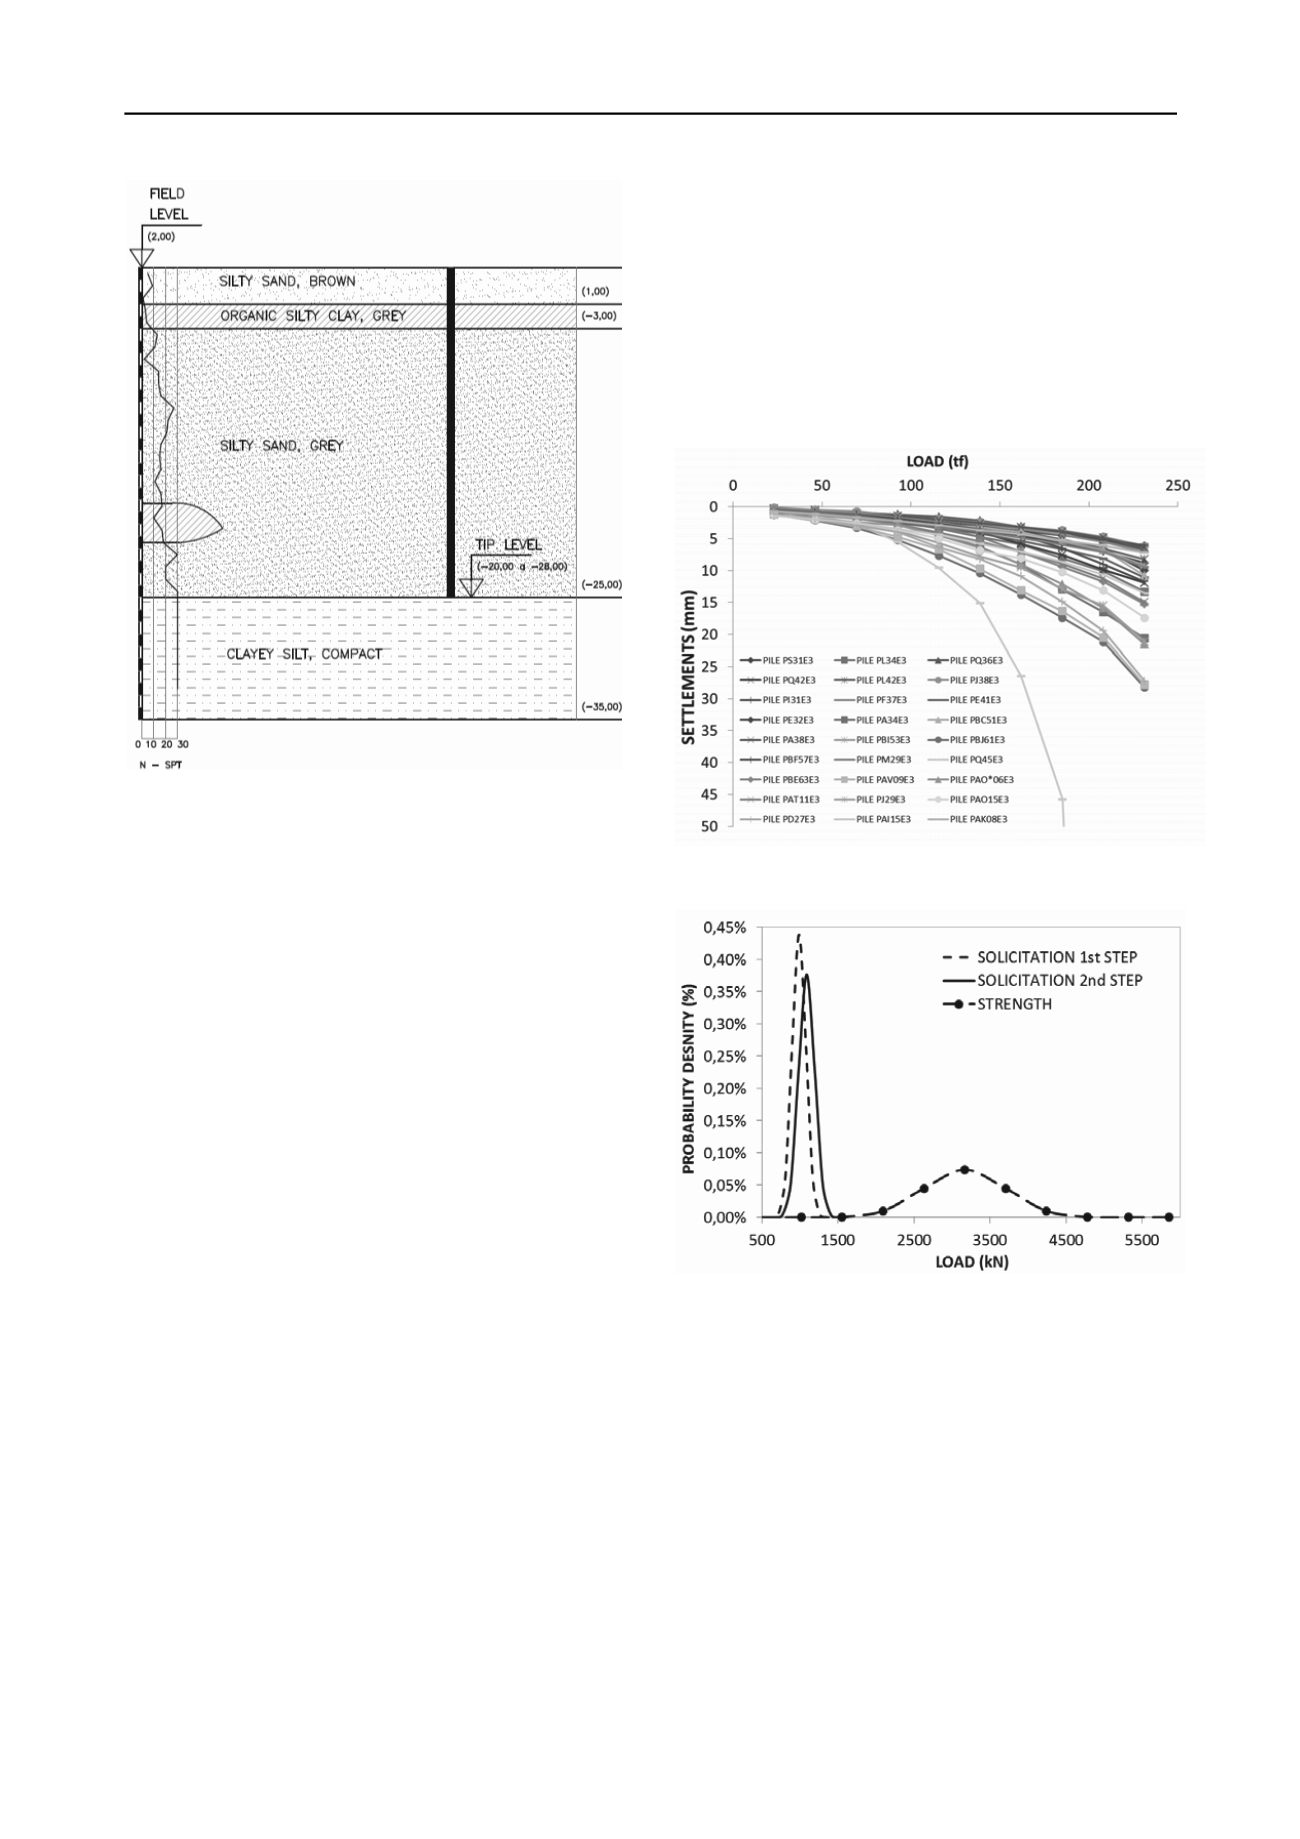
to be redone. Figure 2a shows the diagram regarding Load x
Settling for the piles analyzed in the study. The Van der Veen
equation was used as a criterion for extrapolating the rupture
load for the load tests.
Figure 1. Subsoil profile
The final total of all piles placed, both before and after the
revision, came to 3,838. A total of 38 static load tests were
programmed throughout the project, 27 for 500 mm piles, 09 for
the 600 piles, and 02 for 400 mm piles. However, two of the
load tests, specifically the 33rd and 34th, indicated problems in
the pile caps, and had to be redone. Figure 2a shows the
diagram regarding load versus settlement for the piles analyzed
in the study. The Van der Veen equation was used as a criterion
for extrapolating the geotechnical rupture load for the load tests.
3 STATISTICAL ANALYSIS
A mean value (µR) can be imagined in a representative area
where the resistances are distributed, and a standard deviation
(σR) can measure the distance this data is from this mean
average. Analogically, in designing the details of a project with
deep foundations, normally the piles are not designed with
expectations to have to withstand maximum admissible loads.
Generally, verifiable loads are less than, but close to admissible,
presenting an average (µS), and standard deviation (σS)..Since
not all locations in the subsoil present the same resistance, it is
possible that in a certain location, the resistance is found to be
less than that which is required to withstand the load indicated.
The likelihood that this phenomenon occurs is called the
probability of failure.
Sample variation can be measured by the ratio between the
standard deviation and the mean, this ratio is called the
coefficient of variation. Reliability is a concept opposed to
variability. The reliability index (β) is defined as the inverse of
the coefficient of variation. The reliability index increases as the
normal distribution is concentrated to a greater degree around
the mean. The concept of a Safety Margin, which is defined as
the difference between the requirements demanded, and the
actual resistance, also is distributed normally, and through it can
be obtained the parameters for analysis of potential for failure.
For the case of the project under study, we studied the
probability of failure values before and after revision of the
foundation design project for the piles with 500 mm diameters,
since the number of samples was greater. This review only
changes the curve for requirements, considering that the mean
load (μR) per pile was reviewed. For the first step, which
preceded the review, mean and standard deviation values were
verified for operating loads of 985 and 91.5 kN, respectively.
For the second step, values of 1,086 and 106.0 kN, respectively,
were determined. Regarding load resistance, values of 536 and
3,167 kN were verified. A standard curve can only be set up
using its mean value, and its standard deviation.
From the data obtained, standard curves were plotted for
both steps, similarly for the requirements, and the resistances.
They are presented in Figure 2b. For the first step, the
Reliability Index (β) measured 3.99, and the Probability of
Failure (pf) was 1/30,893. For the second stage, β measured
3.79, and the pf measured 1/13,373.
(a)
(a)
(b)
Figure 2. (a) Results of load tests for the 500mm piles; (b) Standard
curves for the first and second phase compared to the normal curve of
resistance.
The load tests carried out for the project were not conducted
all at once, thus, during the course of testing, the standard
resistance curves could be adjusted to include the last test
performed. As each new test is considered, a different pair of
mean and standard deviation values is obtained. In such a
manner, it is possible to trace standard curves that consider
different steps for implementing quality controls for the
foundation, or for different quantities of static load test
performed, varying the size of the sample until the completion
of predictive control for the work.
As the sample increases, dispersion analysis is
incorporated. This dispersion arises from the variability of the
subsoil profile, the variability of the materials used, and from
the uncertainties regarding measurements of the loads and
settlement.
With introduction of a new section bearing a heavier load,
600 mm piles were also adopted, with load tests indicating a
permissible load of 1,800 kN. At this point, 1,569 stakes had
been planned for completion of the entire project. However, as a
result of the tests, and subsequent project design optimization
taking into account the increased loads, this number fell, in a
second step, to 1,275 (an 18% decrease in the number of
remaining piles). This decrease resulted in a direct cost
reduction of 1.62 million reais, not taking into account the
number of blocks needed, and also the indirect costs.
Considering the costs involved in performing the load tests, the
actual cost reduction amounted to 1.08 million reais.
The final total of all piles placed, both before and after the
revision, came to 3,838. A total of 38 (thirty-eight) static load
tests were programmed throughout the project, 27 (twenty
seven) for 500 mm piles, 9 (nine) for the 600 piles, and 2 (two)
for 400 mm piles. However, two of the load tests, specifically
the 33rd and 34th, indicated problems in the pile caps, and had
to be redone. Figure 2a shows the diagram regarding Load x
Settling for the piles analyzed in the study. The Van der Veen
equation was used as a criterion for extrapolating the rupture
load for the load tests.
Figure 1. Subsoil profile
The final total of all piles placed, both before and after the
revision, came to 3,838. A total of 38 static load tests were
programmed throughout the project, 27 for 500 mm piles, 09 for
the 600 piles, and 02 for 400 mm piles. However, two of the
load tests, specifically the 33rd and 34th, indicated problems in
the pile caps, and had to be redone. Figure 2a shows the
diagram regarding load versus settlement for the piles analyzed
in the study. The Van der Veen equation was used as a criterion
for extrapolating the geotechnical rupture load for the load tests.
3 STATISTICAL ANALYSIS
A mean value (µR) can be imagined in a representative area
where the resistances are distributed, and a standard deviation
(σR) can measure the distance this data is from this mean
average. Analogically, in designing the details of a project with
deep foundations, normally the piles are not designed with
expectations to have to withstand maximum admissible loads.
Generally, verifiable loads are less than, but close to admissible,
presenting an average (µS), and standard deviation (σS)..Since
not all locations in the subsoil present the same resistance, it is
possible that in a certain location, the resistance is found to be
less than that which is required to withstand the load indicated.
The likelihood that this phenomenon occurs is called the
probability of failure.
Sample variation can be measured by the ratio between the
standard deviation and the mean, this ratio is called the
coefficient of variation. Reliability is a concept opposed to
variability. The reliability index (β) is defined as the inverse of
the coefficient of variation. The reliability index increases as the
normal distribution is concentrated to a greater degree around
the mean. The concept of a Safety Margin, which is defined as
the difference between the requirements demanded, and the
actual resistance, also is distributed normally, and through it can
be obtained the parameters for analysis of potential for failure.
For the case of the project under study, we studied the
probability of failure values before and after revision of the
foundation design project for the piles with 500 mm diameters,
since the number of samples was greater. This review only
changes the curve for requirements, considering that the mean
load (μR) per pile was reviewed. For the first step, which
preceded the review, mean and standard deviation values were
verified for operating loads of 985 and 91.5 kN, respectively.
For the second step, values of 1,086 and 106.0 kN, respectively,
were determined. Regarding load resistance, values of 536 and
3,167 kN were verified. A standard curve can only be set up
using its mean value, and its standard deviation.
From the data obtained, standard curves were plotted for
both steps, similarly for the requirements, and the resistances.
They are presented in Figure 2b. For the first step, the
Reliability Index (β) measured 3.99, and the Probability of
Failure (pf) was 1/30,893. For the second stage, β measured
3.79, and the pf measured 1/13,373.
(a)
(a)
(b)
Figure 2. (a) Results of load tests for the 500mm piles; (b) Standard
curves for the first and second phase compared to the normal curve of
resistance.
The load tests carried out for the project were not conducted
all at once, thus, during the course of testing, the standard
resistance curves could be adjusted to include the last test
performed. As each new test is considered, a different pair of
mean and standard deviation values is obtained. In such a
manner, it is possible to trace standard curves that consider
different steps for implementing quality controls for the
foundation, or for different quantities of static load test
performed, varying the size of the sample until the completion
of predictive control for the work.
As the sample increases, dispersion analysis is
incorporated. This dispersion arises from the variability of the
subsoil profile, the variability of the materials used, and from
the uncertainties regarding measurements of the loads and
settlement.


