2733
Technical Committee 212 /
Comité technique 212
Proceedings of the 18
th
International Conference on Soil Mechanics and Geotechnical Engineering, Paris 2013
3.2
Tip stress distribution by pile location in the group pile
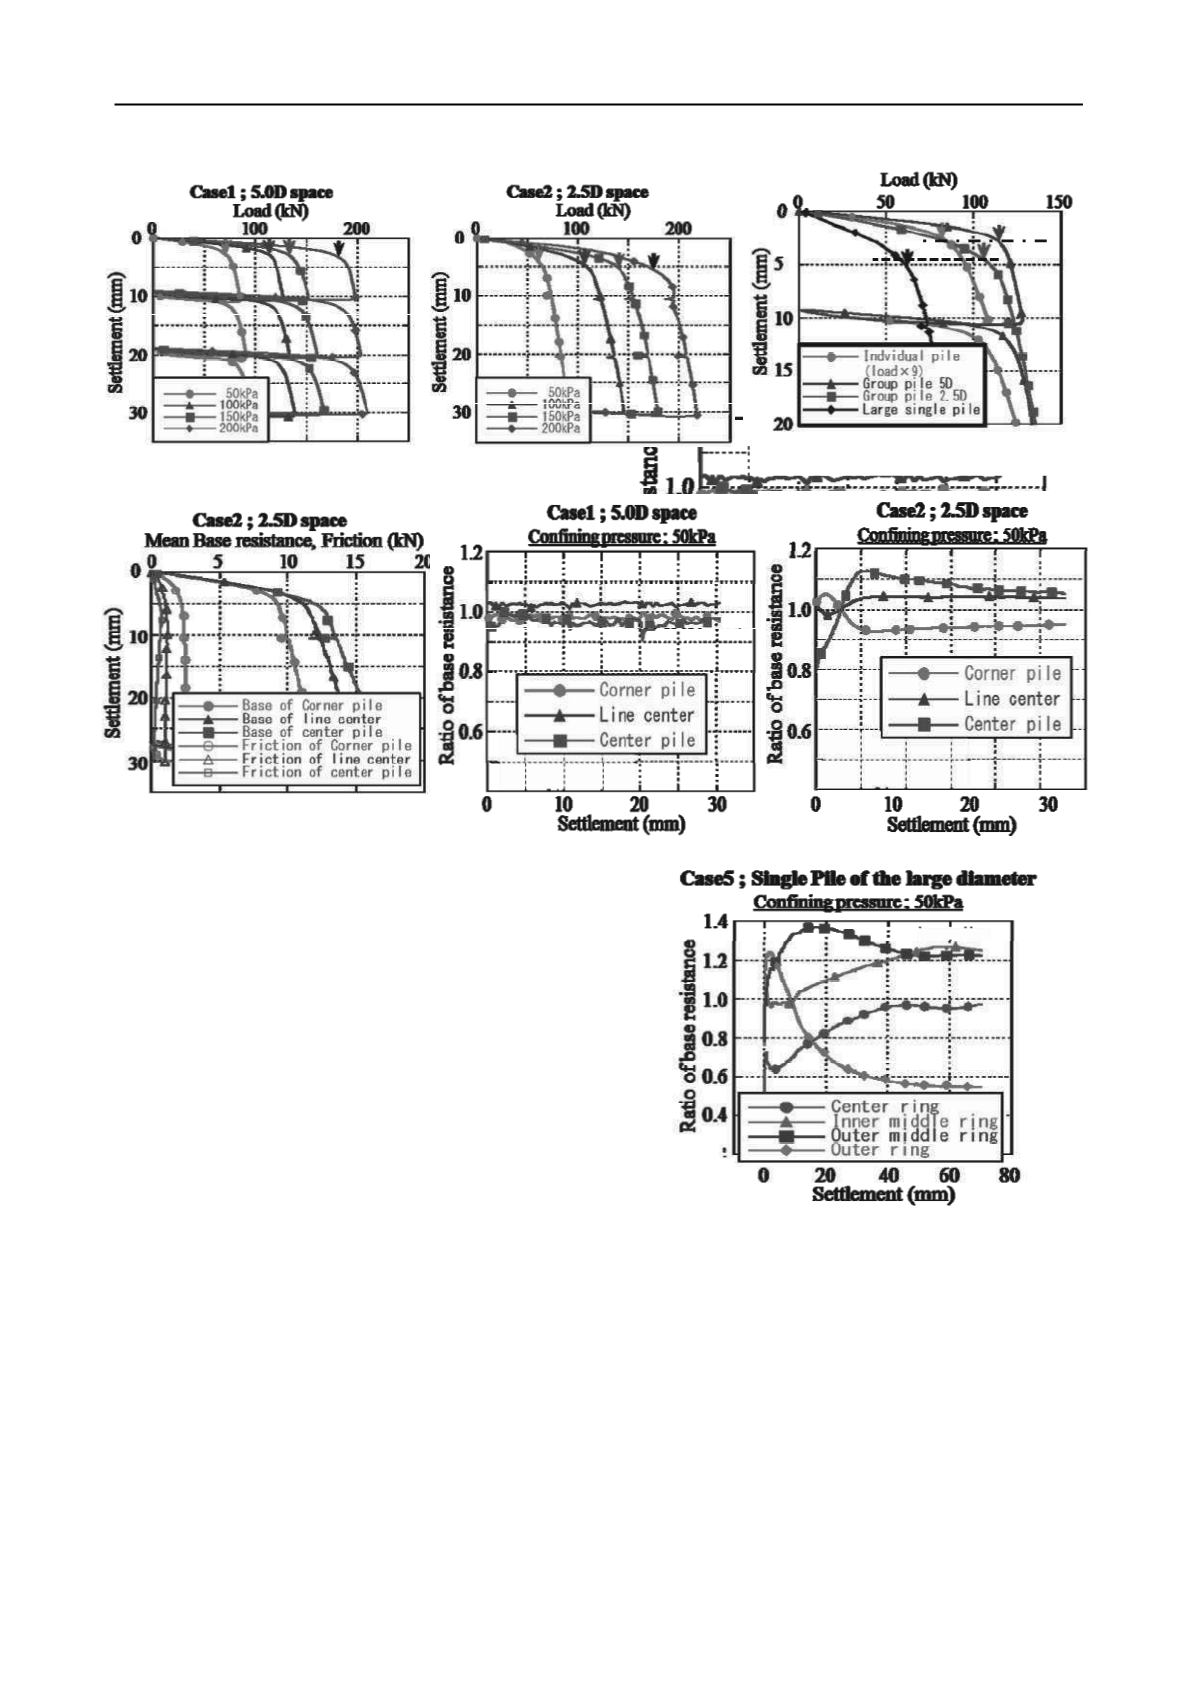
Figure 7 shows the mean pile tip resistance and skin friction
changing with the location of piles
–
at the center (B2 pile in
Fig.1), center of perimeter (A2, B1, B3 and C2), and corner
(A1, A3, C1 and C3) in the group pile 2.5D spacing. The figure
shows that the behavior of each pile in the group pile varies
with the location if the spacing is small.
The skin friction of the corner pile was most significant and
that of the center pile was the least for 2.5D spacing. The soil
immediately below the tip of the central pile was affected by the
other piles and moved down with piles as Fig.12 shows. That is
why the skin friction of the center pile became smaller. In
contrast, the corner piles were in contact with the outer ground
that was less affected by pile displacement. Hence the skin
friction on the corner pile was largest.
The tip resistance of the center pile was the largest and that of
the corner pile was the smallest. This would be because the
ground below the center pile was compacted by other piles.
To discuss the tip resistance more in detail, the resistance ratio
was plotted in Fig. 8. This figure shows the tip resistance
changing with the location of piles, normalized by the total tip
resistance under the confining pressure of 50kPa. With 5.0D
spacing, the ratio of each pile was almost equal to unity
throughout the loading. It suggests that each pile behaved
independently. In contrast, for 2.5D spacing, the ratio changed
with the penetration of the group pile. The load concentration
shifted from the corner piles to the center pile.
Figure 9 shows the tip resistance changing with the location
within the bottom of the large pile that was measured by annular
load cells as shown Fig.4. The stress concentration also shifted
from the edge to the center of the pile. The tendency of the
stress concentration changing in the bottom of one pile was
similar to that of the 2.5D spacing group pile. This suggests that
the significant interaction occurred in the 2.5D spacing group
pile and all 9 piles behaved as a block.
3.3
Response of tactile sensor
Figure 10 shows the normal pressure distribution at the bottom
of the soil tank, measured by tactile sensors. The lighter color
means higher pressure. The distance between the bottom of
piles and the sensors was 290 mm. In both pile spacings, the
highest pressure occurred below the center pile and the pressure
decreased in an annular manner.
In contrast, the stress distribution near the tip of the piles
varied with the spacing of piles. Fig. 11 shows the stress
distribution when the distance between the pile tip and the
sensor was 110 mm. For 5.0D spacing, the higher pressure
occurred individually below the bottom of each pile. On the
other hand, in case of 2.5D spacing, the pressure distribution
looks like one block and the maximum pressure occurred in the
zone between piles and formed a circular shape. This also
Figure 5. Total Load - settlement curve in the pile
Figure 6. Total Load - settlement curve
in both the single pile and the pile group
Figure 7. Mean base resistance and friction
Figure 8. Ratio of base resistance
Figure 9. Distribution of contact pressure at base
in a single pile with the large diameter


