2724
Proceedings of the 18
th
International Conference on Soil Mechanics and Geotechnical Engineering, Paris 2013
interaction factor between reference pile 1 and pile
j
and
j
=
2,…,
n.
2 FULL-SCALE TESTING
The field testing program consisted of performing five
compression load tests on four non-instrumented piles of
different sizes at two sites: site (A) is composed primarily of
sand; and site (B) is mainly clayey soil. Two axial compressive
load tests were conducted at Site (A) and three axial
compression load tests were conducted at site (B). The piles
installed at site (A) had single helix, while those installed at site
(B) had double and triple helices. The load tests conformed to
procedure A of ASTM D1143 for axial compression testing.
The subsurface soil condition at site (A) included a top 0.3m
of an organic soil material followed by a thin brown clay layer
that extends 0.5m and consists of silt and sand, and traces of
gravel. Underlying the clay layer is a sand layer that extends to
9m below ground surface. The sand ranged from fine grained at
the top to coarse grained with increasing depth. The Standard
Penetration Test (SPT) blow count number indicated loose to
medium dense sand conditions with depth. The natural moisture
content was averaged at 20% along depth. The groundwater
table was not observed at the time of drilling and the piles were
installed and tested during the month of October.
The subsurface soil profile established from the boreholes at
site (B) comprises a surficial fill layer of sand and gravel mixed
with some organics and extends to 1.5m with an SPT number
ranging between 5 and 6. Underlying the surficial layer is
medium to stiff brown silt and sand that extends to depths
between 2.3m to 4.6m below ground surface with an SPT
number varying between 3 and 12. Further deep is a silty clay
layer that extends to depths 6.1m and 7.6m below ground
surface. The silty clay layer gets softer with increasing depth
and the SPT number ranged from 6 to 0. The ground water table
was encountered 1.0 m below the ground surface.
The tested piles geometrical properties were representative
of typical helical piles geometry in projects that involve light to
medium loading conditions and are summarized in Tables 1 and
2 for site (A) and site (B), respectively.
The test results were used exclusively to calibrate and verify
the numerical models that were then used to perform the
parametric study.
Table 1. Summary of tested piles configurations at site (A)
Test Pile
Depth
(m)
Shaft Diameter
(mm)
Helix Diameter
(mm)
PA-1
5.5
273
610
PA-3
5.6
219
508
Table 2. Summary of tested piles configurations at site (B)
Test Pile
Depth
(m)
Shaft Diameter
(mm)
Helix Diameter
(mm)
PB-1
7.2
178
610x610x610
PB-2
7.2
178
610x610x610
PB-4
3.2
114
406x406
3 NUMERICAL MODELING
A finite element model is developed using the program
ABAQUS (SIMULIA, 2009) to simulate the experimental
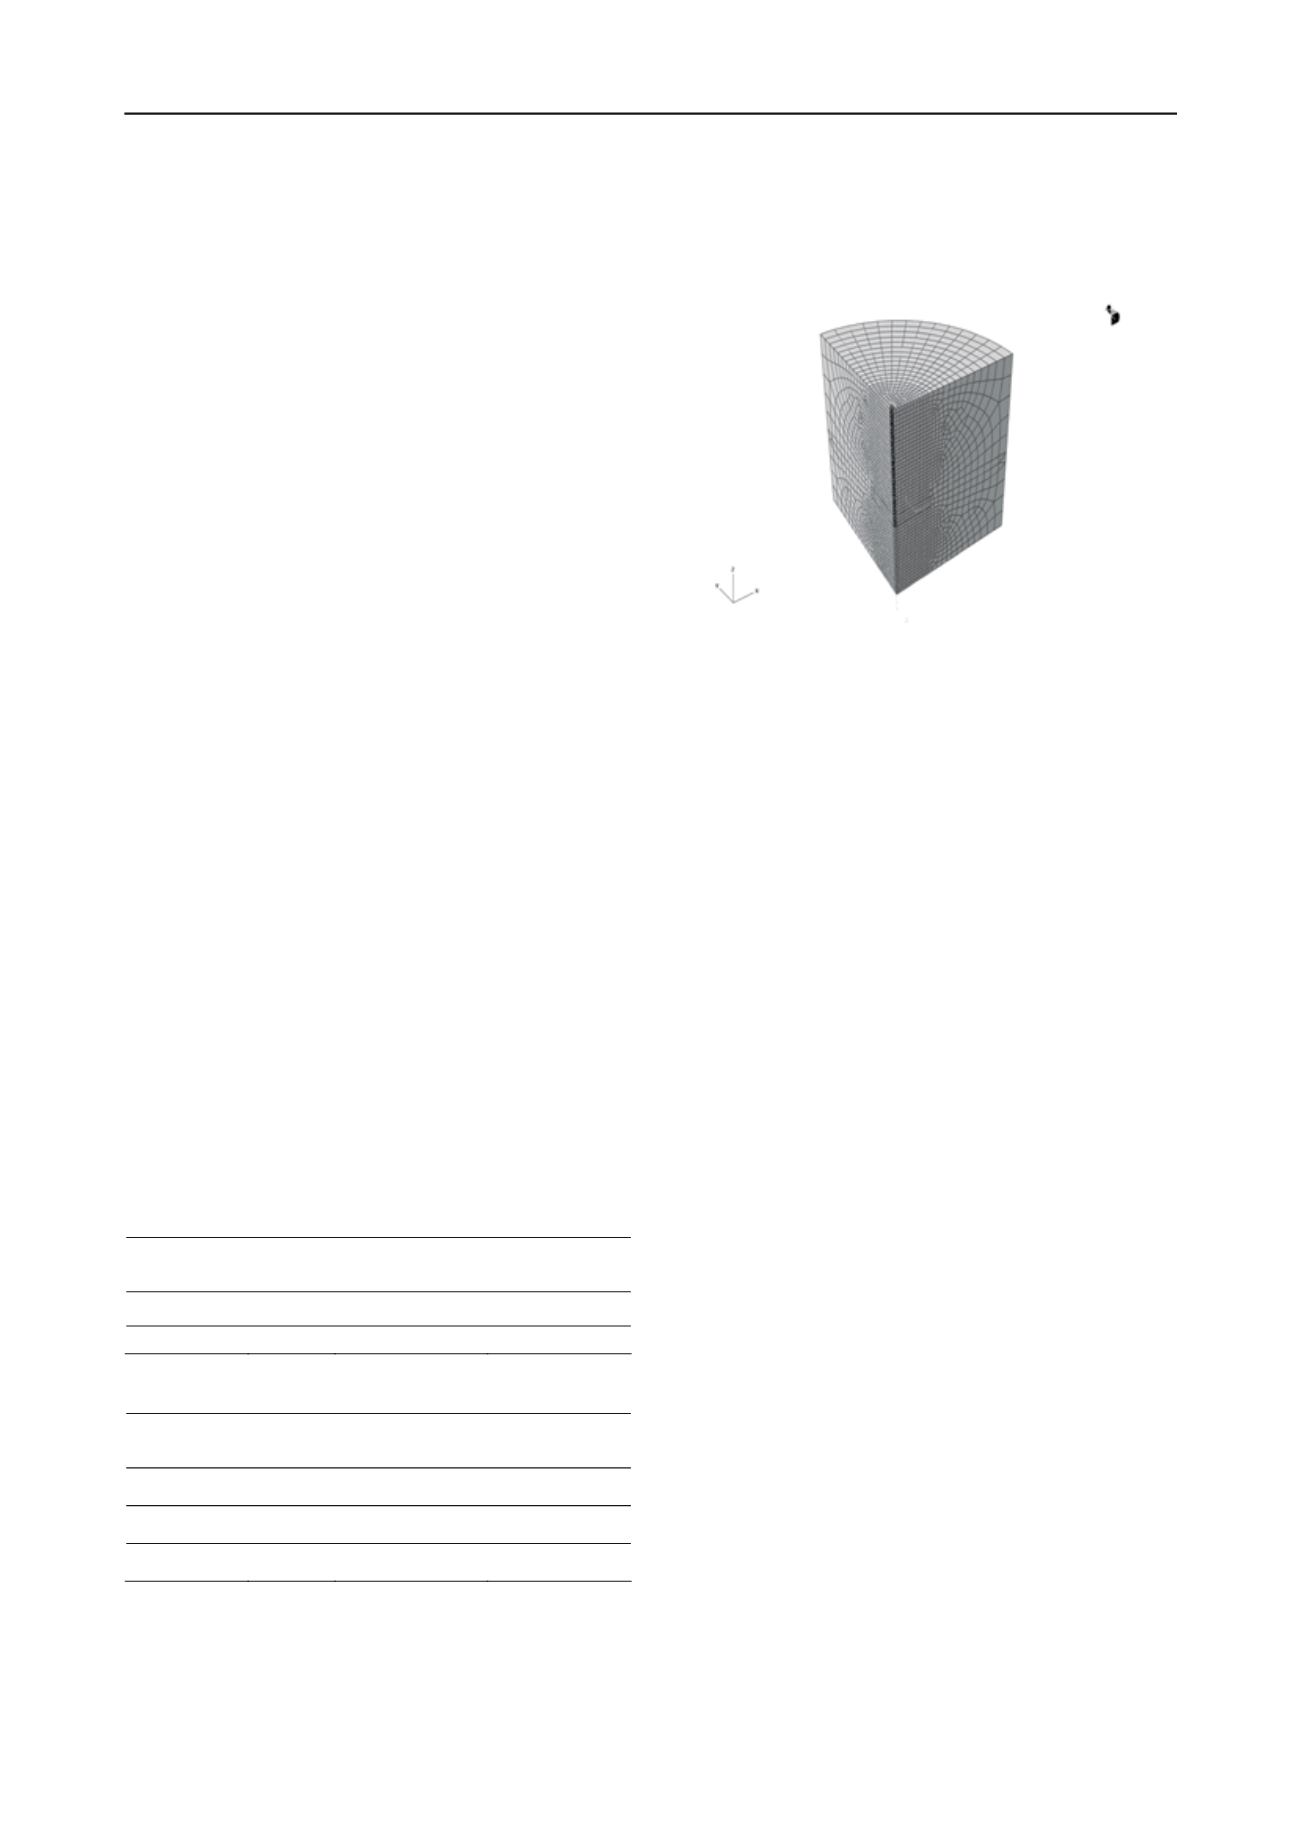
program. The soil continuum is modeled considering a 3D
cylindrical configuration and the pile is placed along the axial z-
direction of the cylinder. The helix is idealized as a planar
cylindrical disk so that modeling of the pile and the surrounding
soil can take advantage of the axisymmetric conditions as
shown in Figure 1.
Figure 1. Numerical model geometry for a single pile subjected to axial
load.
3.1
Model description
The 3-dimensional soil medium is discretized into 8-noded, first
order, and reduced integration continuum solid elements
(C3D8R). The element has three active translational degrees of
freedom at each node and consists of one integration point
located at the centroid. The pile is simulated using four-nodes,
first order, reduced integration, general-purpose shell elements
(S4R).
The boundaries are located such that there is minimal effect
on the results. The radius of the soil column extends
approximately 33 shaft diameters from the center of the pile
shaft. The depth of soil deposits below the lower helix is a
minimum of 6.5 helix diameters. The top soil surface is
considered as stress-free boundary. The boundary conditions
exploited symmetry to reduce the model size. The bottom of the
soil cylinder is pinned. The back of the cylinder is constrained
in the horizontal plane and is free to move vertically.
The soil is modeled as an isotropic elastic-perfectly plastic
continuum with failure described by the Mohr-Coulomb yield
criterion. The elastic behavior was defined by Poisson’s ratio,
ν
,
and Young’s modulus,
E
. The plastic behavior is defined by the
residual angle of internal friction,
ϕ
r
, and the dilation angle,
ψ
,
and material hardening is defined by the cohesion yield stress,
c
,
and absolute plastic strain,
ε
pl
.
The pile-soil interface is modeled using the Tangential
Behavior Penalty-type Coulomb’s frictional model. The soil
unit weight is accounted for in the numerical model as an initial
stress through the geostatic equilibrium step.
3.2
Calibration and verification
Using some of the test results, the above model properties and
configurations, and representative soil properties obtained from
the boreholes and the literature, the numerical models are
calibrated satisfactorily considering the soil conditions and load
test results of piles PA-1 and, PB-1 and PB-2 as shown in
Figures 2 and 3. The soil properties used in the analysis are
assumed to be the disturbed properties due to pile installation.
program. The soil continuum is modeled considering a 3D
cylindrical configuration and the pile is placed along the axial z-
direction of the cylinder. The helix is idealized as a planar
cylindrical disk so that modeling of the pile and the
surrounding soil can take advantage of the axisymmetric
conditions as shown in Figure 1.
Figure 1. Numerical model geometry for a single pile subjected to axial
load.
3.1
Model description
The 3-dimensional soil medium is dis ret zed into 8-nod d, first
order, and reduced integration continuum s lid elements
(C3D8R). The element has three active translational degrees of
freedom at each node and consists of one integration point
located at the centroid. The pile is simulated using four-nodes,
first order, reduced integration, gen al-purpose shell
elements (S4R).
The boundaries are located such that there is minimal
effect on the results. The radius of the soil column extends
approximately 33 shaft diam ters fr m the cent r f the pile
shaft. The depth of soil deposits below the lower helix is a
minimum of 6.5 helix diameters. The top soil surface is
considered as stress-free boundary. The boundary conditions
exploited symmetry to reduce the model size. The bottom of
the soil cylinder is pinned. The back of the cylin er is
constrained in the horizontal plane and is free to move
vertically.
The soil is modeled as an isotropic elastic-perfectly plastic
continuum with failure described by the Mohr-Coulomb yield
criterion. The elastic behavior was defined by Poisson’s ratio,
ν
,
and Young’s modulus,
E
. The plastic behavior is defined by the
residual angle of internal friction,
ϕ
r
, and the dilation angle,
ψ
,
and material hardening is defined by the cohesion yield stress,
c
, and absolute plastic strain,
ε
pl
.
The pile-soil interface is modeled using the Tangential
Behavior Penalty-type Coulomb’s frictional model. The soil unit
weight is accounte fo in the numerical mod l a n initial
stress through the geostatic equilibrium step.
3.2
Cali
Using so
configurat
from the
are calibr
load test
Figures 2
assumed t
Figure 2. C
Figure 3. C
In ord
accurately
compressi
utilized (c
and interf
data and
actual tes
4(a), and
a)


