2720
Proceedings of the 18
th
International Conference on Soil Mechanics and Geotechnical Engineering, Paris 2013
Proceedings of the 18
th
International Conference on Soil Mechanics and Geotechnical Engineering, Paris 2013
Shong approach is adapted in the analysis of the results in this
study.
This paper represents a study to investigate the behavior of
soil-pile interaction during soil consolidation. Since full-scale
testing of the influence of the large number of variables
involved is economically unreasonable, a simulated laboratory
experiment has been designated. A special rig was designed
and constructed for this purpose. In order to carry out the
investigations, experimental program was developed.
2 EXPERIMENTAL WORK
(Nasser 2010) arranged the experimental rig as shown in Figure
1. Three P.V.C circular model piles with different diameters of
1.5, 2 and 2.5 cm were chosen to model the pile in this study.
Compression tests were carried out on a specimen of this P.V.C
pipes to determine its modulus of elasticity. The modulus of
elasticity of the pile material; P.V.C is 1500000 KN/m
2
. The
surface of the pile is smooth.
Fig. 1 The experimental rig
Two layers of sand with depth 5cm for each layer. One of
these layers placed on the surface of soft soil and the second
layer under the soil.
Bentonite soil has been adapted for the experimental
investigation in this study. 85% water content provides a soft
consistency of bentonite. For this condition initial void ratio is
2.38, bulk density is 16 KN/m
3
.
A surcharge has to be applied to the soil layer for
consolidation. Steel and lead plates of 1.2kN total weight were
arranged for the surcharge. These loads simulate a surcharge of
1m fill of unit weight 17kN/m
3
.
The vertical displacement of the model pile and the soil
surface were measured using dial gauges. The displacement of
the model pile is measured at its center. The soil settlement is
measured at a point located at the mid distance between the pile
shaft and the container wall.
Strain gauges are fixed at various depths of the length of the
pile to measure the strains occurred on the pile during soil
consolidation. Number and locations of the strain gauges are
designed depending on the thickness of the clay layer.
Table (1) illustrates the experimental program. Three cases
of boundary conditions were considered in this study. The first
case is the pile ended in the clay layer. This represents clay end
bearing case. The second case is the pile ended in the sand
layer. And the last case represents floating pile. That is, the pile
passes through the lower plate and not resting on any soil. This
case is aimed to investigate the pure shaft resistance without the
interference of the end condition.
Table (1) Different cases with code for each test
No.
Cases
Pile
Diameter
(cm)
L/d Pile
Length
(cm)
Code No. of
Strain
gages
1
10
15 L15EC
3
2
15
22.5
L22.5EC 3
3
1.5
20
30 L30EC
4
4
10
20 L20EC
3
5
15
30 L30EC
4
6
2
20
40 L40EC
4
7
10
25 L25EC
4
8
CASE I (end bearing
clay EC)
2.5
15
37.5
L37.5EC 4
9
10
15
L15ES
3
10
15
22.5
L22.5ES 3
11
1.5
20
30
L30ES
4
12
10
20
L20ES
3
13
15
30
L30ES
4
14
2
20
40
L40ES
4
15
10
25
L25ES
4
16
CASE II (end bearing
sand ES)
2.5
15
37.5
L37.5ES 4
17
10
25
L25F
4
18
15
37.5
L37.5F
4
19
Floating
(F)
2.5
20
50
L50F
4
250mm
50mm
100mm
Soil artificial
soft clay
Steel
Circularplate
P.V.Cpipe
Sand layer
Steel rod
Valve
Perforatedplate
Circular
plate
Theapplied
surcharge
DataLogger
DialGauge
Straingauge
Filterpaper
3 RESULTS AND ANALYSIS
3.1
Time–strain behavior of pile model
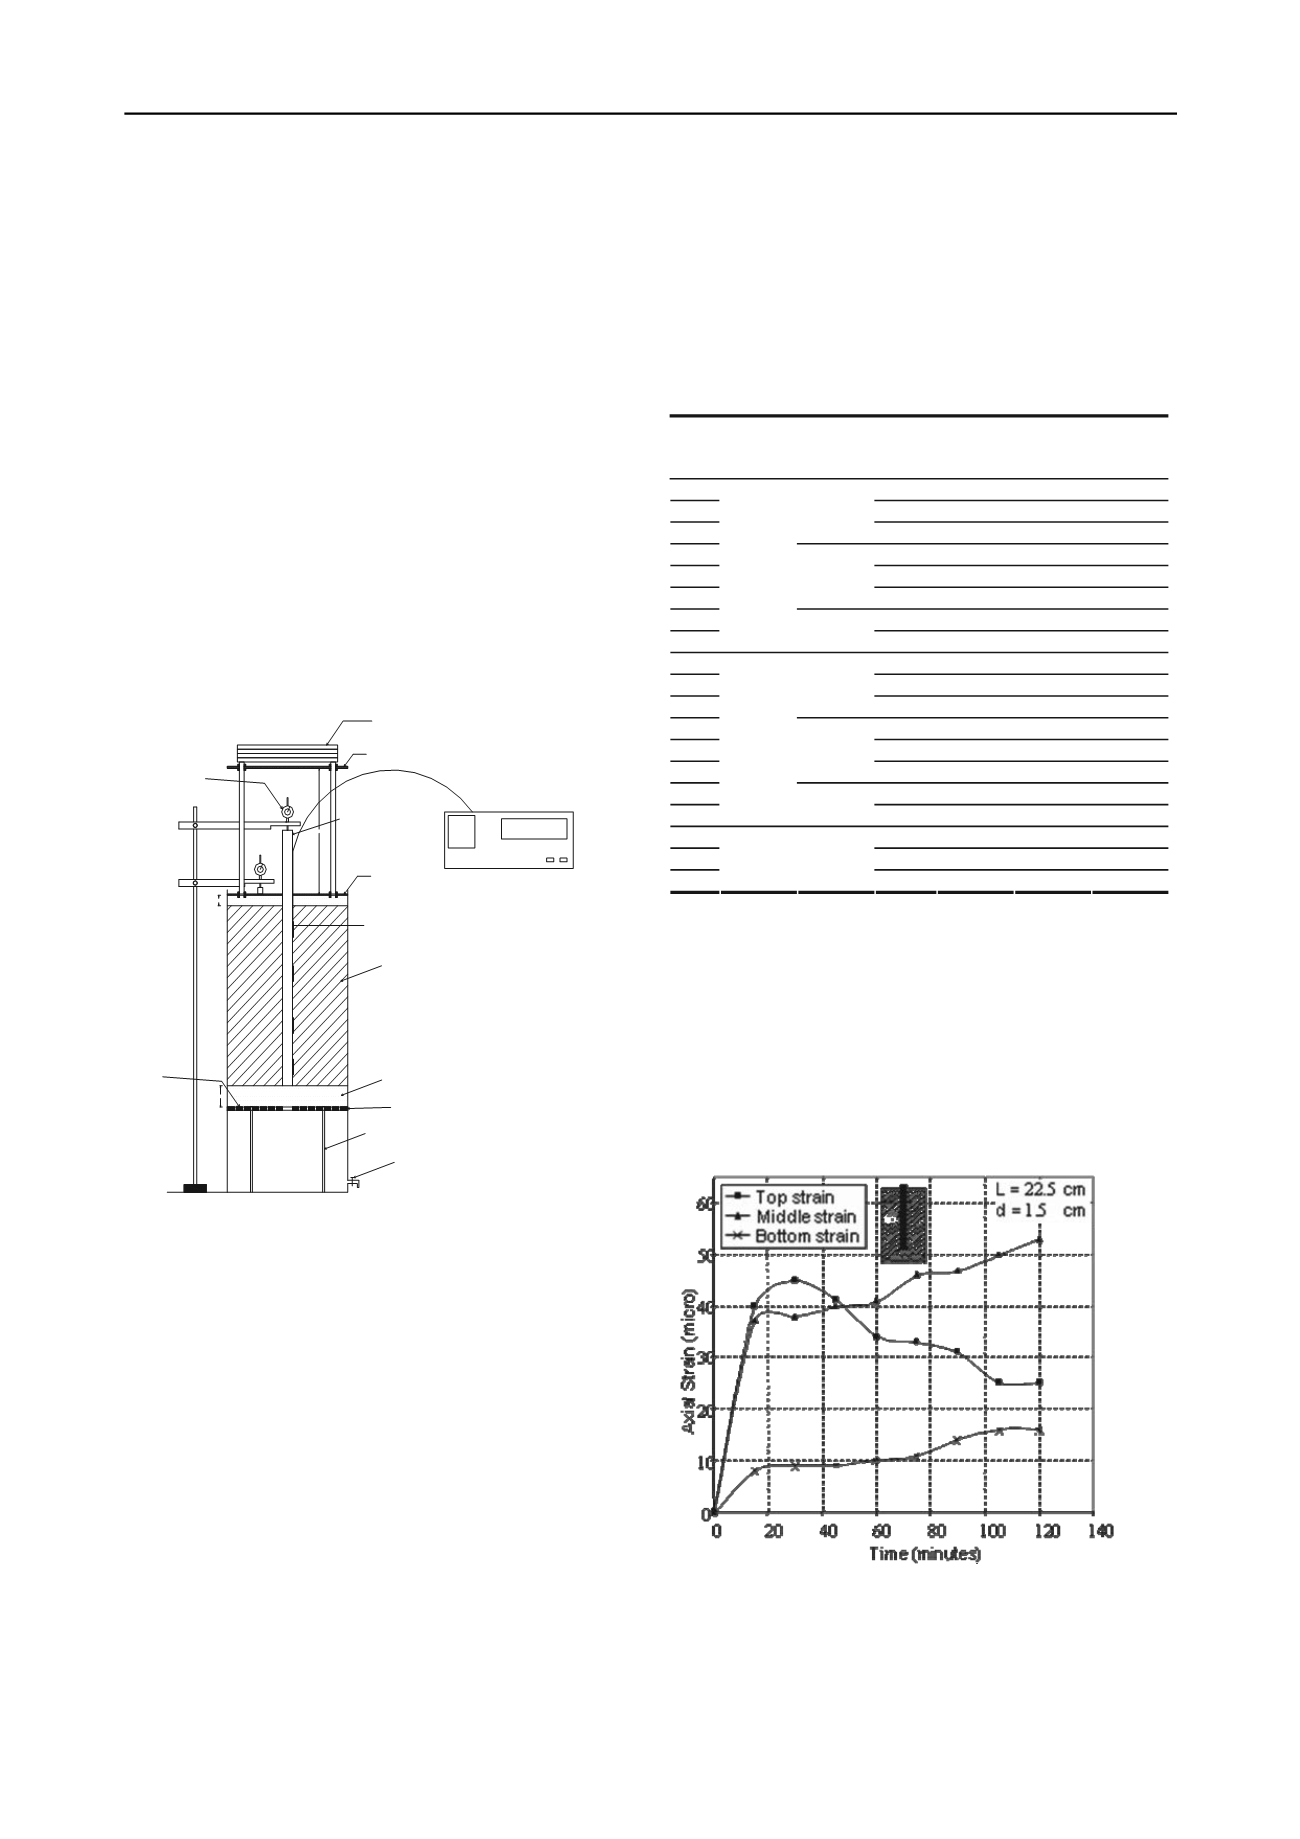
Figures 2 shows the axial strain with time of applying the
surcharge, for pile model (L22.5Ec). From the Figure, it can be
seen that the top strain is higher and occurs earlier than the
middle and the bottom strains. However, it declines just after
reaching the early peak. The other strains continue increasing
until the end of the test.
Fig. 2 Time-Axial strain curves of pile model (L22.5Ec)
It is clear that the top portion of the deposit go through
consolidation due to the nearby surcharge faster than the
remaining deposit. By the time being, the rate of water
dissipation decreases, and, hence, the axial strain decreases.
The middle axial strains continue increasing with lower rate
Proceedings of the 18
th
International Conference on Soil Mechanics and Geotechnical Engineering, Paris 2013
2
Shong approach is adapted in the analysis of the results in this
study.
This paper represents a study to investigate the behavior of
soil-pile interaction during soil consolidation. Since full-scale
testing of the influence of the large number of variables
involved is economically unreasonable, a simulated laboratory
experiment has been designated. A special rig was designed
and constructed for this purpose. In order to carry out the
investigations, experimental program was developed.
2 EXPERIMENTAL WORK
(Nasser 2010) arranged the experimental rig as shown in Figure
1. Three P.V.C circular model piles with different diameters of
1.5, 2 and 2.5 cm were chosen to model the pile in this study.
Compression tests were carried out on a specimen of this P.V.C
pipes to determine its modulus of elasticity. The modulus of
elasticity of the pile material; P.V.C is 1500000 KN/m
2
. The
surface of the pile is smooth.
Fig. 1 The exper mental rig
Two layers of sand with depth 5cm for each layer. One of
these layers placed on the surface of soft soil and the second
layer under the soil.
Bentonite soil has been adapted for the experimental
investigation in this study. 85% water content provides a soft
consistency of bentonite. For this condition initial void ratio is
2.38, bulk density is 16 KN/m
3
.
A surcharge has to be applied to the soil layer for
consolidation. Steel and lead plates of 1.2kN total weight were
arranged for the surcharge. These loads simulate a surcharge of
1m fill of unit weight 17kN/m
3
.
The vertical displacement of the model pile and the soil
surface were measured using dial gauges. The displacement of
the model pile is measured at its center. The soil settlement is
measured at a point located at the mid distance between the pile
shaft and the container wall.
Strain gauges are fixed at various depths of the length of the
pile to measure the strains occurred on the pile during soil
consolidation. Number and locations of the strain gauges are
designed depending on the thickness of the clay layer.
Table (1) illustrates the experimental program. Three cases
of boundary conditions were considered in this study. The first
case is the pile ended in the clay layer. This represents clay end
bearing case. The second case is the pile ended in the sand
layer. And the last case represents floating pile. That is, the pile
passes through the lower plate and not resting on any soil. This
case is aimed to investigate the pure shaft resistance without the
interference of the end condition.
Table (1) Different cases with code for each test
No.
Cases
Pile
Diameter
(cm)
L/d Pile
Length
(cm)
Code No. of
Strain
gages
1
10
15 L15EC
3
2
15
22.5
L22.5EC 3
3
1.5
20
30
30
4
4
10
20 L20EC
3
5
15
30 L30
4
6
2
20
40 L40EC
4
7
10
25
25
4
8
CASE I ( nd bearing
clay EC)
2.5
15
37.5
L37.5EC 4
9
10
15
15 S
3
10
15
22.5
22.5 S 3
11
1.5
20
30
30
4
12
10
20
L20ES
3
13
15
30
L30
4
14
2
20
40
40
4
15
10
25
25
4
16
CASE II ( nd bearing
sand ES)
2.5
15
37.5
L37.5ES 4
17
10
25
L25F
4
18
15
37.5
L37.5F
4
19
Floating
(F)
2.5
20
50
50
4
250mm
50mm
100mm
Soil artificial
soft clay
Steel
Circularplate
P.V.Cpipe
Sand layer
Steel rod
Valve
Perforatedplate
Circular
plate
Theapplied
surcharge
DataLogger
DialGauge
Straingauge
Filterpaper
3 RESULTS AND ANALYSIS
3.1
Time–strain behavior of pile model
Figures 2 shows the axial strain with time of applying the
surcharge, for pile model (L22.5Ec). From the Figure, it can be
seen that the top strain is higher and occurs earlier than the
middle and the bottom strains. However, it declines just after
reaching the early peak. The other strains continue increasing
until the end of the test.
Fig. 2 Time-Axial strain curves of pile model (L22.5Ec)
It is clear that the top portion of the deposit go through
consolidation due to the nearby surcharge faster than the
remaining deposit. By the time being, the rate of water
dissipation decreases, and, hence, the axial strain decreases.
The middle axial strains continue increasing with lower rate
Proceedings of the 18
th
International Conference on Soil Mechanics and Geotechnical Engineering, Paris 2013
Shong approach is adapted in the analysis of the results in this
study.
This paper represents a study to investigate the behavior of
soil-pile interaction during soil consolidation. Since full-scale
testing of the influence of the large number of variables
involved is economically unreasonable, a simulated laboratory
experiment has been designated. A special rig was designed
and constructed for this purpose. In order to carry out the
investigations, experimental program was developed.
2 EXPERIMENTAL WORK
(Nasser 2010) arranged the experimental rig as shown in Figure
1. Three P.V.C circular model piles with different diameters of
1.5, 2 and 2.5 cm were chosen to model the pile in this study.
Compression tests were carried out on a specimen of this P.V.C
pipes to determine its modulus of elasticity. The modulus of
elasticity of the pile material; P.V.C is 1500000 KN/m
2
. The
surface of the pile is smooth.
Fig. 1 The experimental rig
Two layers of sand with depth 5cm for each layer. One of
Table (1) illustrates the experimental program. Three cases
of boundary conditions were considered in this study. The first
case is the pile ended in the clay layer. This represents clay end
bearing case. The second case is the pile ended in the sand
layer. And the last case represents floating pile. That is, the pile
passes through the lower plate and not resting on any soil. This
case is aimed to investigate the pure shaft resistance without the
interference of the end condition.
Table (1) Different cases with code for each test
No.
Cases
Pile
Diameter
(cm)
L/d Pile
Length
(cm)
Code No. of
Strain
gages
1
10
15 L15EC
3
2
15
22.5
L22.5EC 3
3
1.5
20
30 L30EC
4
4
10
20 L20EC
3
5
15
30 L30EC
4
6
2
20
40 L40EC
4
7
10
25 L25EC
4
8
CASE I (end bearing
clay EC)
2.5
15
37.5
L37.5EC 4
9
10
15
L15ES
3
10
15
22.5
L22.5ES 3
11
1.5
20
30
L30ES
4
12
10
20
L20ES
3
13
15
30
L30ES
4
14
2
20
40
L40ES
4
15
10
25
L25ES
4
16
CASE II (end bearing
sand ES)
2.5
15
37.5
L37.5ES 4
17
10
25
L25F
4
18
15
37.5
L37.5F
4
19
Floating
(F)
2.5
20
50
L50F
4
250mm
50mm
100mm
Soil artificial
soft clay
Steel
Circularplate
P.V.Cpipe
Sand layer
Steel rod
Valve
Perforatedplate
Circular
plate
Theapplied
surcharge
DataLogger
DialGauge
Straingauge
Filterpaper
3 RESULTS AND ANALYSIS
3.1
Time–strain behavior of pile model
Figures 2 shows the axial strain with time of applying the
surcharge, for pile model (L22.5Ec). From the Figure, it can be
seen that the top strain is higher and occurs earlier than the
middle and the bottom strains. However, it declines just after
reaching the early peak. The other strains continue increasing
until the end of the test.


