2729
Technical Committee 212 /
Comité technique 212
specified at the pile-soil contact surface. The interface
parameters were specified as tangential interface.
The pile installation process has been simplified to an
eventual expansion of the soil from a zero radius up to the 225.5
mm. In other words, cavity expansion has been simulated in
axisymmetric condition, therefor effects of eventual pile shaft
penetration are not considered in this study. The PWP at the end
of cavity expansion (U
0
) has the maximum magnitude,
corresponding to t=0 in the presented results.
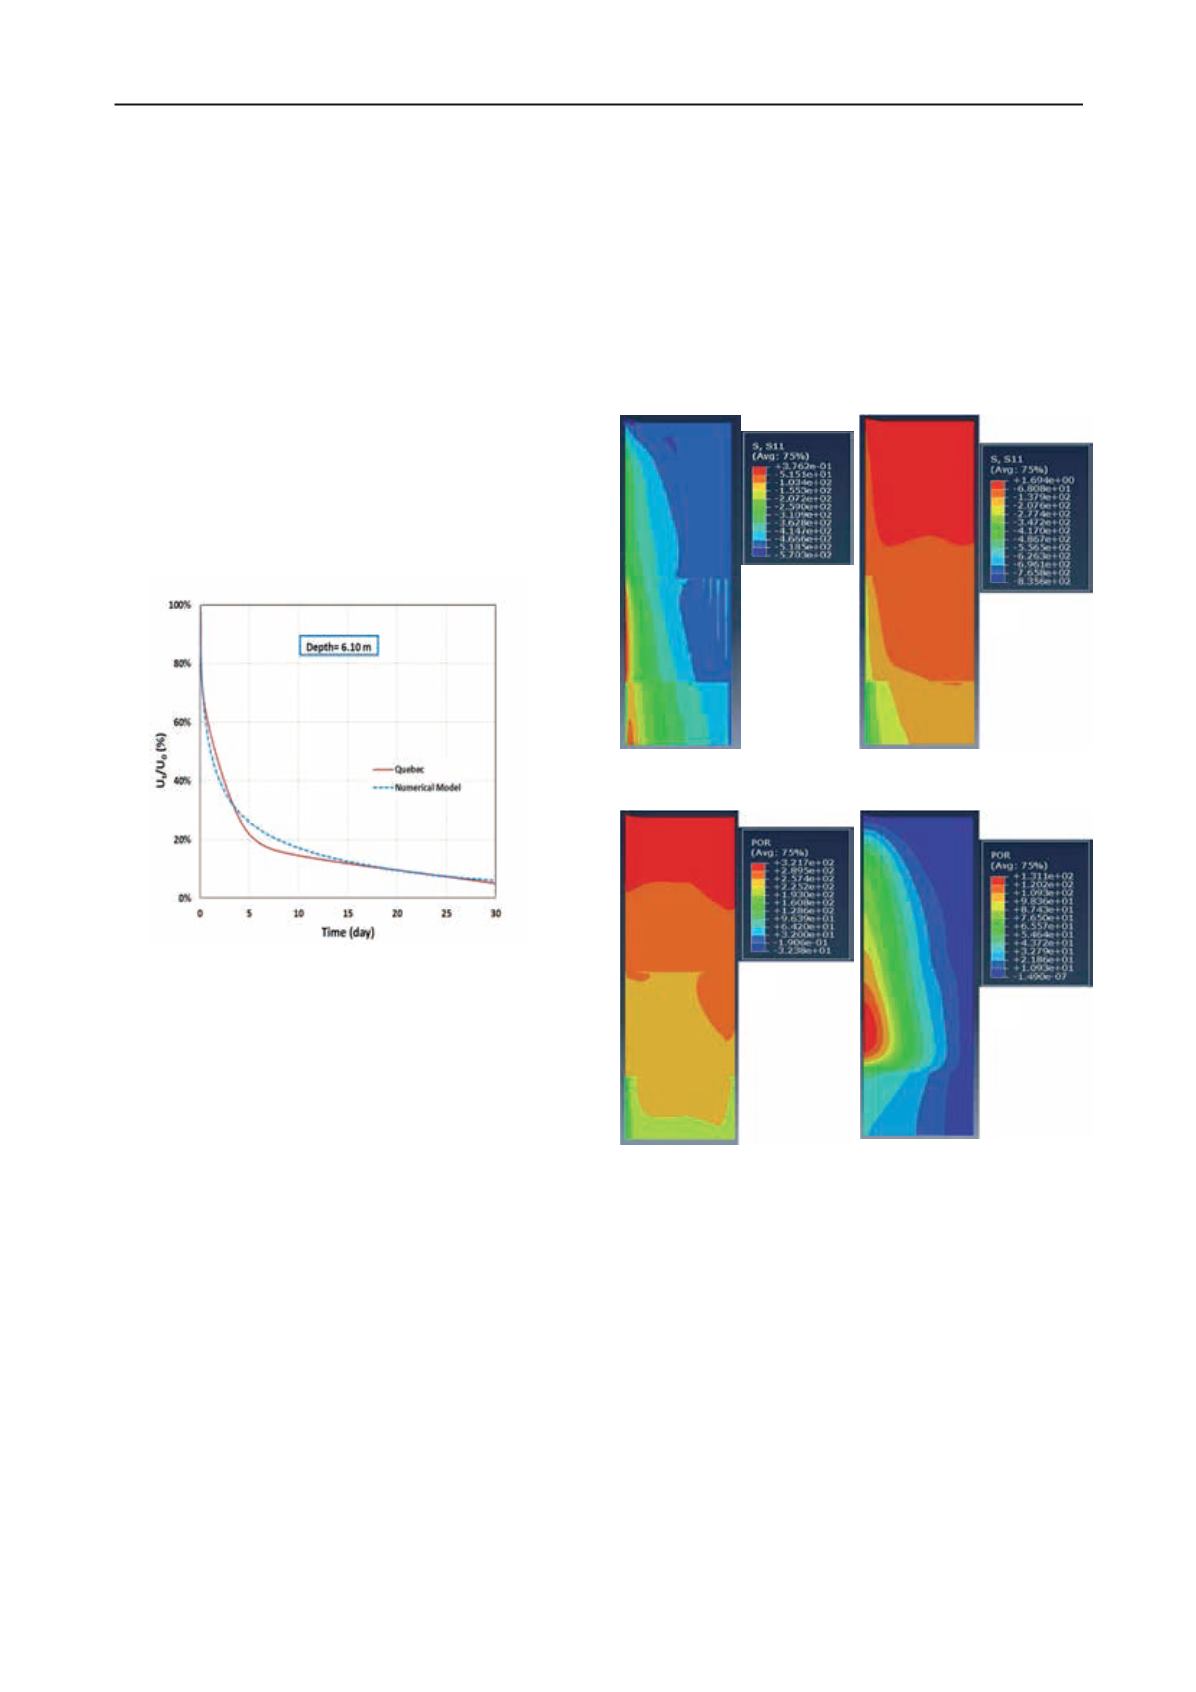
Validation of the numerical model was done by comparing
the numerical model results with the results of instrumented
case that is reported by Konrad and Roy (1987).It is noticed that
the numerical model predictions compare reasonably well with
measurements.For example, Figs. 3 representthe dissipation of
EPWP resulted from driving at depth 6.1 m with time. The
EPWP at any time t (U
t
) is normalized with U
0
and expressed in
percentage. Therefore U
t
/U
0
at t=0 is 100% and supposed to
approach 0 at sufficiently long periods of time, depending on
the permeability of the soil material. More details of
verification process may be found in Haddad et al. (2012).
Figure 3.Dissipation of EPWP with time resulted from pile driving at
depth 6.1 m.
4 ANALYSIS RESULTS
The main focus of this study is effect of setup on skin friction.
The important factors contributing to variation of skin friction
with time are radial effective stress and PWP adjacent to the
pile shaft, as far as the effect of dissipation of EPWP is
concerned. To account for aging effects, the interface shear
strength parameters have been considered. The interface
strength parameters have been specified applying the
β′
reduction factor introduced by Fakharian and Iraji (2010) as:
τ
int
=
β′
(c
′
+
σ
tan
φ′
)
in which:
τ
int
: shear strength at interface
c
′
: effective cohesion of adjacent soil
φ′
: effective angle of internal friction of adjacent soil
Figure 4 shows the contour lines of effective radial stress
along the pile shaft and up to the boundaries both at the end of
initial drive (4a) and after 13 days (4b). It is observed that the
radial stress has substantially increased as a result of dissipation
of EPWP. Similarly, Fig. 5 presents the PWP at the end of
initial drive (5a) and after 13 days (5b).Pore water pressure
significantly increased due to the compressibility of the soft
soil, except close to the ground surface that the dissipation has
occurred rapidly due to short distance to the open boundary.
Comparing the results of Figs. 3 and 4 indicate that in zones
that higher PWP has been generated at EOID, higher radial
effective stress is developed after 13 days that about60% of
EPWP has dissipated. Figure 6 presents the variation of
effective radial stress with time between initial
in situ
condition
up to end of EPWP dissipation along the pile shaft. It is of
importance to note that the effective radial stress at EOID is
considerably greater than initial
in situ
condition. This could be
attributed to passive stress path outside the expanded cavity
zone, indicating compaction of the soil. This requires further
investigation with more advanced constitutional models and
field measurements. The change in variations at depths of 7.4
and 12.4 m is because of soil layer differences.
Figure 4.Radial effective stress distribution innumerical model:
(a) EOID, (b) BOR after 13 days.
Figure 5.Excess pore water pressure distribution in numerical model: (a)
EOID, (b) BOR after 13 days.
The main objective of this study has been attempting to
distinguish between dissipation of EPWP and aging. As an
example, variation of shaft capacity with respect to time are
plotted in Fig. 7, resulted both from the back-calculation of field
PDA tests and model predictions. The PDA test results are
available for EOID and 13 days, depicted in Fig. 7 by for four
solid square symbols.
In the numerical model, adopting a
β′
of 0.235 has resulted
in a good match between the EOID ofPDA test and model
prediction. In other words, after the simulation of initial drive
(cavity expansion), as an EOID condition,
β′
was adjusted till
the predicted and measured capacities have a good correlation.
Then dissipation was allowed for 1, 4, 13 and 50 days (with the
same
β′
) and the shaft capacity is calculated. The shaft capacity
results from this procedure are plotted with green solid line
(circled symbols) betweenEOID to 50 days. Considerably lower
capacities are resulted compared to the measured capacities.
This difference is thought to be attributed to the so-called aging
effects.
(a)
(b)
(a)
(b)


