2737
Technical Committee 212 /
Comité technique 212
Thus, with sample growth, the standard deviation increases,
and the probability density around the mean decreases, leaving
the curve with a flatter appearance (recalling that the area
considered between the standard curve and the abscissa is equal
to the unity) . This can be seen in Figure 3, which depicts the
variation of the shape of the standard curve, due to the growth
of the sample until the final number of load tests performed (N
= 27).
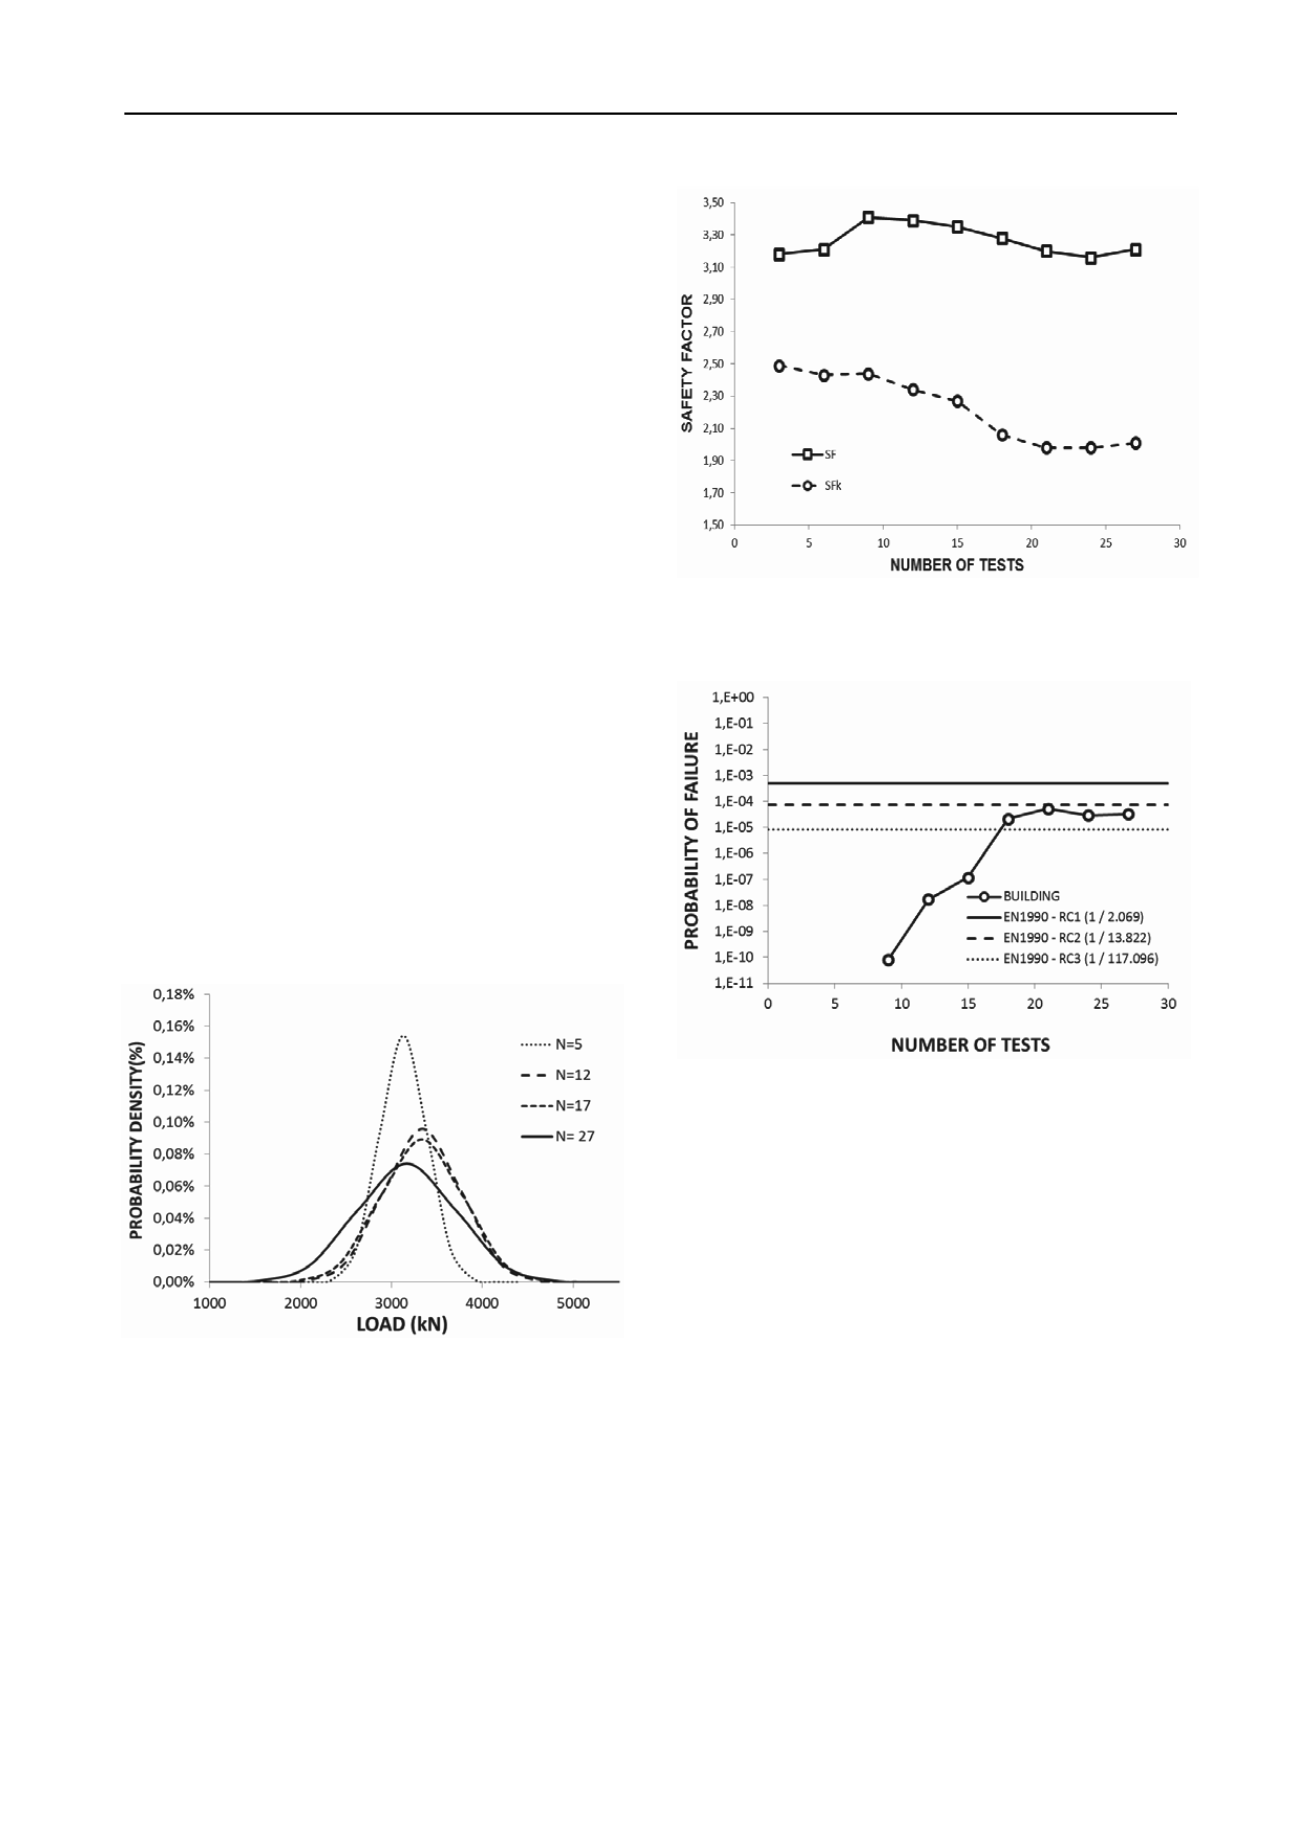
In a deterministic analysis, foundation safety is verified by
means of the Global Safety Factor (FSg), which is the ratio
between the mean resistance and mean requirement. However,
for an analysis where the effects of sample dispersion are
intended to be considered, as with Probability of Failure, the
Safety Characteristic Factor (FSk) must be also considered. This
factor is defined as the ratio between the Resistance
Characteristic (Rk) and the Requirement Characteristic (Sk).
The Resistance characteristic represents the mean resistance
increased from Z.σR, as well as the characteristic that is
obtained by minimizing the mean requirement in Z. σS (where
Z represents the reliability interval, usually equal to 95%,
equivalent to Z = 1.65). Figure 3b makes comparison between
the Global Safety Factor, and the Safety Characteristic Factor as
the sample increases.
Figure 4. Variation of global and partial safety factors relative to the
number of load tests
.
As already seen, as sample space increases, population
dispersion is incorporated into the sample, and the standard
deviation tends to increase. In this manner, as dispersion
increases, the reliability index represented by β decreases and
eventually the Probability of Failure increases. Thus, on the
basis of everything that has been presented, it was verified that
with an increase in number of load tests, the probability of
failure increased until practically constant between the values of
15 and 20 load tests performed, i.e. 0.35 to 0.48% of the project
piles tested. Figure 5 shows the variation of failure probability
in function of the increase of the number of load tests, compared
with the limits set by the European code EN1990.
Figure 5. Variation of the probability of failure with an increase in the
number of load tests.
3 CONCLUSIONS
With growth of the sample, the standard deviation increases,
and probability density around the mean decreases, leaving the
curve with a flatter appearance. As sample space increases,
population dispersion is incorporated into the sample, and the
standard deviation tends to increase. As the dispersion
increases, the reliability index represented by β decreases, and
probability of failure increases. It was possible to verify that
with an increase in the number of load tests, the probability of
failure increased until practically constant when reaching 15 and
20 load tests performed, and 0.35 to 0.48% of the project piles
having been tested. The safety characteristic factor showed to
be, as expected, always less than the global security factor,
however, with values remaining above levels permitted by
codes.
Figure 3. Standard curves varying according to the number of
load tests analyzed.
4 REFERENCES
Gusmão Filho, J.A; Gusmão, A.D. and Maia. G.B. 1998. Prática de
fundações na cidade do Recife: Exemplos de Casos (in Portuguese). 12º
Congresso Brasileiro de Mecânica dos Solos e Engenharia Geotécnica,
Brasília, Vol.3, pp.1415-1422.
Thus, with sample growth, the standard deviation increases,
and the probability density around the mean decreases, leaving
the curve with a flatter appearance (recalling that the area
considered between th standard curve and the abscissa is equal
to the unity) . This can be seen in Figure 3, which depicts the
variation of the shape of the standard curve, due to the growth
of the sample until the fin l number of load tests performed (N
= 27).
In a deterministic analysis, foun ation safety is verified by
means of the Global Safety Factor (FSg), which is the ratio
between the mean resistance and mean requirement. However,
for an analysis where the effects of sample dispersion are
int nded to be considered, as with Probability of Failure, the
Safety Characteristic Factor (FSk) ust be also considered. This
factor is defined as t e ratio between the Resistance
Characteristic (Rk) and the Requirement Characteristic (Sk).
The Resistan e characteristic represents the mean resistance
increased from Z.σR, as well as th characteristic that is
obtained by minimizing the mean requirement in Z. σS (where
Z represents the reliability interval, usually equal to 95%,
equiv lent to Z = 1.65). Figur 3b mak s comparison between
the Global Safety Factor, and the Safety Characteristic Factor as
the sampl increases.
Figure 4. Variation of global and partial safety factors relative to the
number of load tests
.
As already seen, as sample space increases, population
dispersion is incorporated into the sample, and the standard
deviation te ds to increase. In this manner, as dispersion
increases, the reliability index represented by β decreases and
eventually the Pr bability of Failure increases. Thus, on the
basis of everything that has been presented, it was verified that
with n incr as in number of load tests, the probability of
failure increas d until practically constant betw en the values of
15 and 20 load tests performed, i.e. 0.35 to 0.48% of the project
piles tested. Figure 5 shows the variation of failure probability
in function of the increase of the number of load tests, compared
with the limits set by the European code EN1990.
Figure 5. Variation of the probability of failure with an increase in the
number of load tests.
3 CONCLUSIONS
With growth of the sample, the standard deviation increases,
and probability density around the mean decreases, leaving the
curve with a flatter appearance. As sample space increases,
population dispersion is incorporated into th s mple, and the
standard deviation tends to increase. As the dispersion
increases, the reliability index represented by β decreases, and
pr bability of failure increases. It was p ssible to verify that
with an incr ase in the umber of load tests, the probability f
failure increased until practically consta t when reaching 15 and
20 lo d tests performed, and 0.35 to 0.48% of the project piles
having been tested. The safety characteristic factor showed t
be, as expected, always less than the global s curity factor,
however, with values remaining above levels permitted by
codes.
Figure 3. Standard curves varying according to the number of
load tests analyzed.
4 REFERENCES
Gusmão Filho, J.A; Gusmão, A.D. and Maia. G.B. 1998. Prática de
fundações na cidade do Recife: Exemplos de Casos (in Portuguese). 12º
Congresso Brasileiro de Mecânica dos Solos e Engenharia Geotécnica,
Brasília, Vol.3, pp.1415-1422.


