2725
Technical Committee 212 /
Comité technique 212
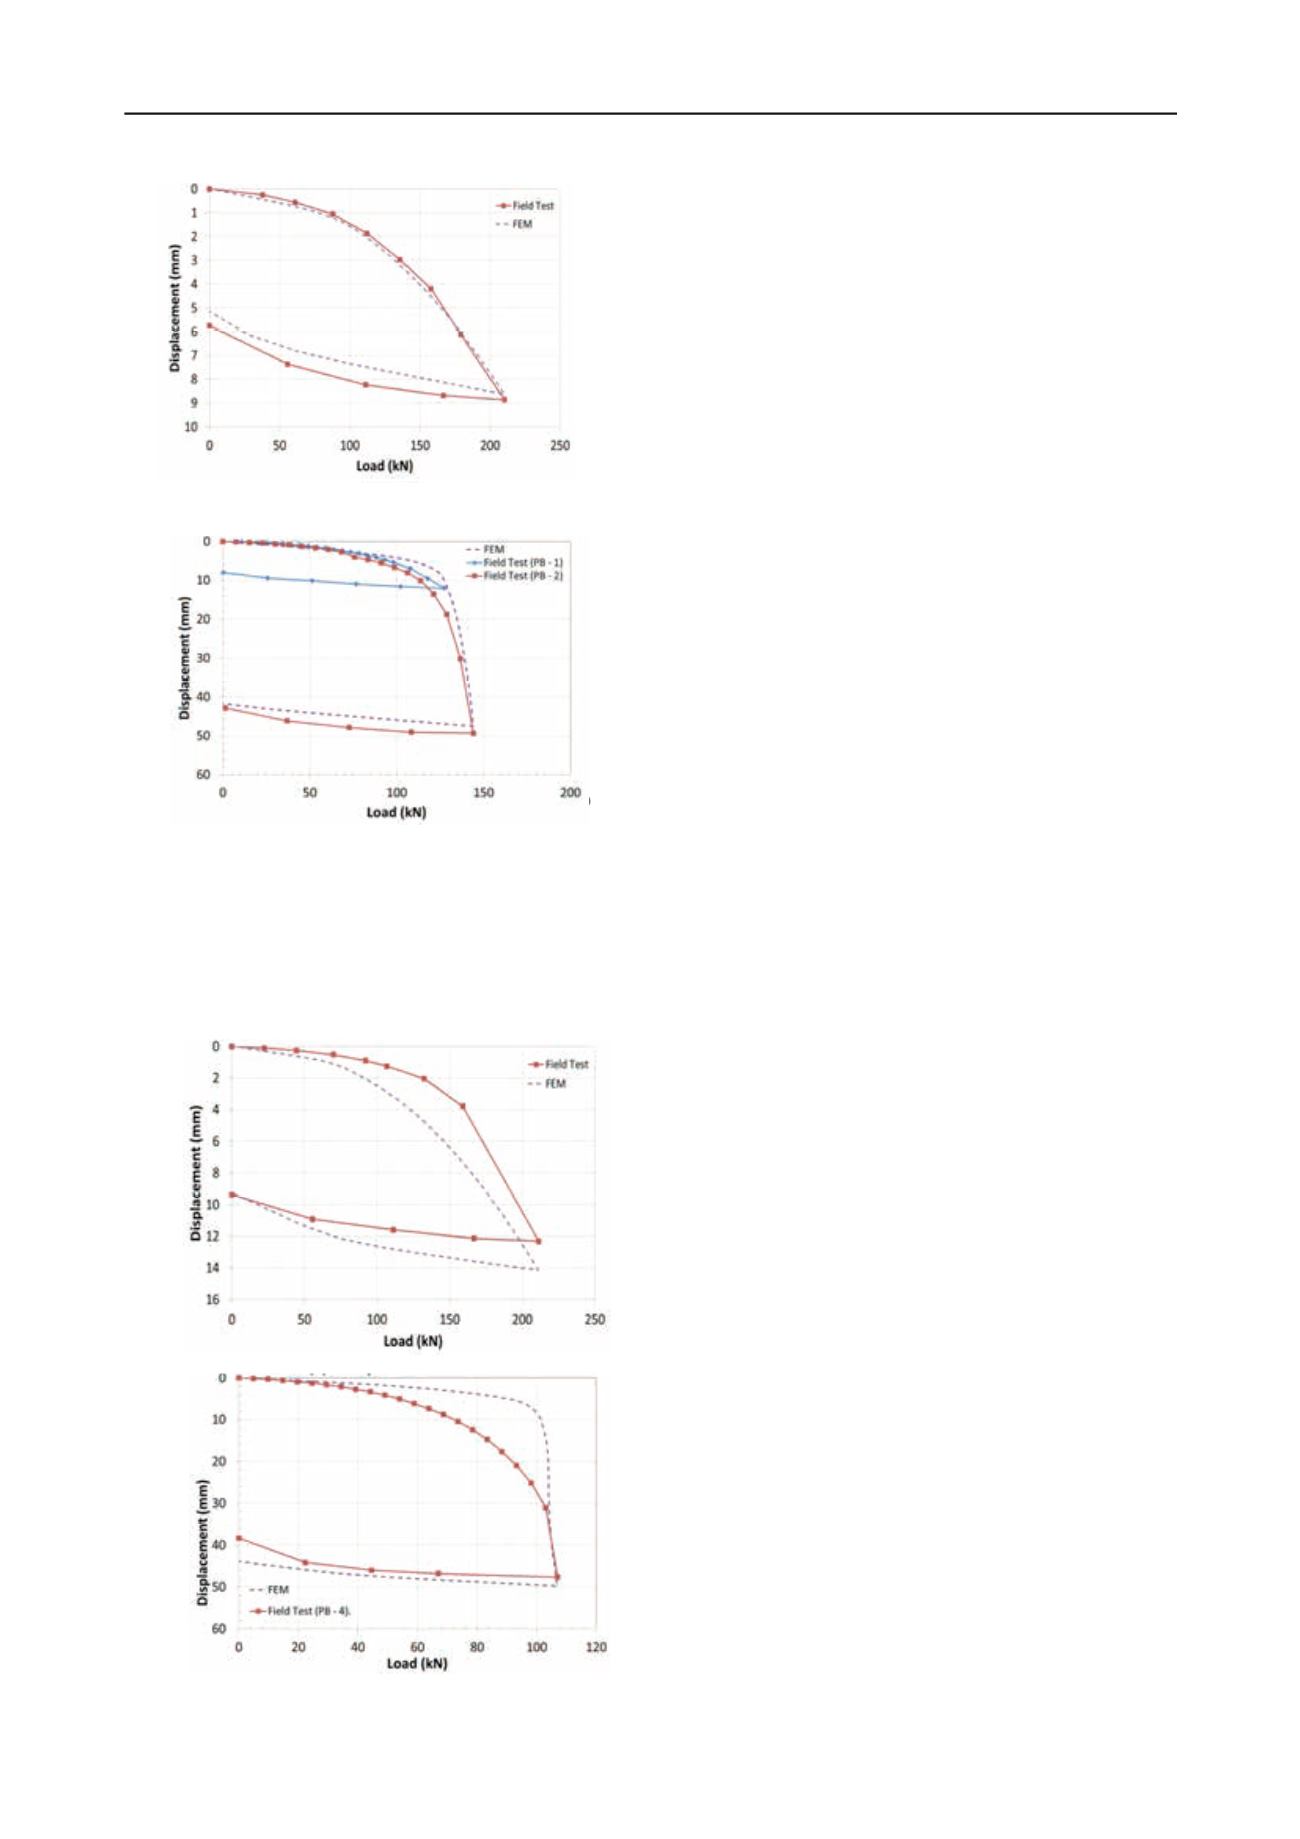
Figure 2. Calibrated numerical model compared to field test of PA-1
Figure 3. Calibrated numerical model of piles PB-1 and PB-2
In order to verify the ability of the calibrated models to
accurately depict the behavior of helical piles under
compressive and lateral loading, the calibrated models were
utilized (considering the same soil properties and boundary and
interface conditions) to analyze the remaining load test data and
the results showed satisfactory agreement with actual test results
of piles PA-3, and PB-4 as shown in Figures 4(a), and 4(b).
Figure 4. Verified numerical models: a) Pile PA-3; b) Pile PB-4.
Using the same soil properties that are established from the
calibration of model considering pile PA-1 test data, the
calculated response of neighbouring pile PA-3 is softer than the
field test results as shown in Figure 4(a), but the calculated
response of pile PB-4 is stiffer than the load test data. This is
expected due to the natural spatial variability of soil properties.
3.3
Parametric study
Using the previously calibrated and validated models, a
numerical parametric study is conducted considering different
practical pile configurations and common soil types. The piles
considered consist of a 273mm diameter steel pipe that has two
610mm helices attached to it. The inter-helix spacing ratio,
S
r
,
ranges between 1 and 3 helix diameters (i.e. 1
D
, 2
D
, and 3
D
)
with a pile embedment depth of 6 m. The piles are modeled as
single, two, and four piles in a square arrangement with a center
to center spacing,
S
p
, ranging between
2D
to
10D
.
The pile is modeled as elastic steel with
E
= 200GPa and
ν
= 0.3. For piles in sand, the sand is modeled as homogeneous
with
ϕ
r
= 30° and
ψ
= 0° to represent loose to medium dense
sand. The yield cohesion,
c
, is 0 kPa to represent purely
frictional sand. The sand is assumed to have a bulk unit weight
of 20 kN/m
3
and an initial coefficient of lateral earth pressure,
K
o
, equal 0.5. Moreover, the pile-soil interface friction angle, δ,
is assumed to be 0.67
ϕ
r
which yields a friction factor of 0.38.
Finally, the modulus of elasticity of the soil is assumed to be
100MPa and the soil Poisson’s ratio, ν = 0.3.
For piles in clay, it is assumed that the helices are embedded
into a very stiff clay layer with undrained shear strength,
c
u
=
100kPa and
E
= 50MPa, while the soil above top helix (i.e.
along the shaft) is soft clay with
c
u
= 25kPa and
E
= 30MPa.
The clay is modeled assuming the water level is at the ground
surface, and the loading rate is assumed fast enough to invoke
undrained conditions. Therefore, Poisson’s ratio = 0.49 was
considered in the analysis. The adhesion,
c
a
, between the pile
and the soil is estimated from CFEM (2006): for
c
u
= 25 kPa,
c
a
= 25 kPa. A friction factor of 1.0 is used indicating that the
frictional stresses along the shaft are equal to the contact
pressure. However, to account for the adhesion strength, a shear
stress limit along the interface is defined at which slippage
occurs. This shear stress limit along the interface is
c
a
.
a
4 RESULTS AND DISCUSSION
For load-settlement curves with no visually distinctive failure
point, as for the case of piles in sand, the failure loads are
obtained at a practical settlement level equal to
5%D
(i.e.
30mm). The pile settlement is obtained at a service load equal to
the failure load divided by a factor of safety,
FS
, equal to 3.
For a 4-pile group in sand,
R
s
could be as high as 1.3 at
S
p
=
2D
and as low as 1.1 at
S
p
=
5D
.
R
s
is the greatest at
S
p
=
2D
and
decreases gradually with increasing
S
p
as shown in Figure 5. It
is also found that
S
r
has a negligible effect on
R
s
. Moreover,
R
s
at service load considering
FS
= 2 is larger than
R
s
for service
loads given by
FS
= 4, as shown in Figure 6. It is also found that
R
s
for a group of piles is not necessarily an algebraic summation
of the interaction factors,
α
ij
, of the piles in the group. The
existence of other piles in a group (other than the two under
consideration) stiffens the soil. Therefore, the interaction factors
would decrease relative to the case of a 2-pile group. Basile
(1999) made similar observations and concluded that the
interaction factors approach may lead to overestimation of pile
response. Furthermore, Randolph (1994) stated that the
interaction factors should only be applied to the elastic
component of settlement since the plastic component of
settlement is largely due to localized failure close to the pile and
is not transferred to neighboring piles.
b
to axial
ed, first
lements
grees of
n point
r-nodes,
e shell
minimal
extends
the pile
elix is a
rface is
nditions
ttom of
inder is
o move
y plastic
b yield
ratio,
ν
,
d by the
ngle,
ψ
,
d stress,
ngential
soil unit
n initial
are calibrated satisfactorily considering the soil conditions and
load test results of piles PA-1 and, PB-1 and PB-2 as shown in
Figures 2 and 3. The soil properties used in the analysis are
assumed to be the disturbed properties due to pile installation.
Figure 2. Calibrated numerical model compared to field test of PA-1
Figure 3. Calibrated numerical model of piles PB-1 and PB-2
In order to verify the ability of the calibrated models to
accurately depict the behavior of helical piles under
compressive and lateral loading, the calibrated models were
utilized (considering the same soil properties and boundary
and interface conditions) to analyze the remaining load test
data and the results showed satisfactory agreement with
actual test results of piles PA-3, and PB-4 as shown in Figures
4(a), and 4(b).
a)
to axial
ed, first
lements
grees of
n point
r-nodes,
e shell
minimal
extends
the pile
lix is a
rface is
nditions
ttom of
inder is
o
ove
y plastic
b yield
ratio,
ν
,
d the
ngle,
ψ
d stress,
ngential
soil unit
i i
assum d to be the disturbed properties due to pile installation.
Figure 2. Calibrated numerical model compared to field test of PA-1
Figure 3. Calibrated numerical model of piles PB-1 and PB-2
In order to verify the ability f the calibrated models to
a curately depict the behavior of helic l piles und r
compressive and lateral lo d ng, the calibrated models were
utilized (considering the same soil propert es and boundary
and interface condi ions) to analyz the remaining load t st
data and the results showed satisfacto y agreement with
ctual st r sults of piles PA-3, and PB-4 as shown in Figures
4(a), and 4(b).
a)
Figure 4. Verified numerical models: a) Pile PA-3; b) Pile PB-4.
Using the same soil properties that are established from
For piles in clay, it is assumed that the helices are
embedded into a very stiff clay layer with undrained shear
strength,
c
u
= 100kPa a d
E
= 50MPa, while the soil above top
helix (i.e. along the shaft) s s ft clay with
c
u
= 25kPa and
E
=
30MPa. The clay is modeled assuming the water level is at the
ground surface, and the loading rate is assumed fast enough to
invoke undrained conditions. Therefore, Poisson’s ratio = 0.49
was considered in the analysis. The adhesion,
c
a
, between the
pile and the soil is estimated from CFEM (2006): for
c
u
= 25 kPa,
c
a
= 25 kPa. A friction factor of 1.0 is used indicating that the
frictional stresses along the shaft are equal to the contact
pressure. However, to account for the adhesion strength, a
shear stress limit along the interface is defined at which
slippage occurs. This shear stress limit along the interface is
c
a
.
4
RESULTS AND DISCUSSION
For load-settlement curves with no visually distinctive failure
point, as for the case of piles in sand the failure loads a e
obtained at a practical settlement level equal t
5%D
(i. .
30mm). The pile settlement is obtained at a service load equal
to the failure load divided by a factor of safety,
FS
, equal to 3.
For a 4-pile group in sand,
R
s
could be as high as 1.3 at
S
p
=
2D
and as low as 1.1 at
S
p
=
5D
.
R
s
is the greatest at
S
p
=
2D
n
decreases gradually with increasing
S
p
as shown in Figure 5. It is
also found that
S
r
has a negligible effect on
R
s
. Moreover,
R
s
at
service load considering
FS
= 2 is larger than
R
s
for service loads
given by
FS
= 4, as shown in Figure 6. It is also found that
R
s
for
b)
Figure 4. Verified numerical models: a) Pile PA-3; b) Pile PB-4.
Using the same soil properties that are established from
th calibratio of model considering pile A-1 test data, the
calculated response of neighbouring pile PA-3 is softer than the
For piles in clay, it is assumed that the helices are
embedded into very stiff clay layer with undrained shear
strength,
c
u
= 100kP and
E
= 5 MPa, wh le the soil above top
helix (i.e. along the shaft) is soft clay with
c
u
= 25kPa and
E
=
30MPa. The clay is modeled assuming the water level is at the
ground surface, and the loading rate is assumed fast enough to
invoke undrained conditions. Therefore, Poisson’s ratio = 0.49
was considered in the analysis. The adhesion,
c
a
, between the
pile and the soil is estimated from CFEM (2006): for
c
u
= 25 kPa,
c
a
= 25 kPa. A fri tion factor of 1.0 is use indi ating that the
frictional stresses along the shaft are equal to the contact
pressure. However, to account for the adhesion strength, a
shear stress limit along the interface is defined at which
slipp ge occurs. This shear stress limit along the interf ce is
c
a
.
4
RESULTS AND DISCUSSION
For load-settlement curves with no visually di tinctive failure
point, as for the case of piles in sa d, the failure lo ds are
obtained at a practical settlement level equal to
5%D
(i.e.
30mm). The pile settlement is obtained at a service load equal
to the failure load divided by a fact r of safety,
FS
, equal to 3.
F r a 4-pile group in sand,
R
s
could b a high as 1.3 at
S
p
=
2D
and as low as 1.1 at
S
p
=
5D
.
R
s
is the greatest at
S
p
=
2D
and
decreases gradually with increasing
S
p
as shown in Figure 5. It is
also found that
S
r
has a negligible effect on
R
s
. Moreover,
R
s
at
service load considering
FS
= 2 is larger than
R
s
for service loads
given by
FS
= 4, as shown in Figure 6. It is also found that
R
s
for
a group of piles is not necessarily an algebraic summation of
the interaction factors,
α
ij
, of the piles in the group. The
b)
a)
b)


