2721
Technical Committee 212 /
Comité technique 212
Proceedings of the 18
th
International Conference on Soil Mechanics and Geotechnical Engineering, Paris 2013
than the initial one. The bottom strain is much less than the
upper and middle ones. The stress increase, and hence the
water dissipation and the soil consolidation, is moderate at the
bottom strain compared with the other two locations.
Figure 3 illustrates the pile strains for pile model (L22.5Ec).
It can be seen from the Figure that the bottom strains are
generally larger when compared with the previous case of pile
ended in clay. This can be attributed to the increased
dissipation of pore water pressure through the bottom layer.
Moreover, sand layers offer resistance to the pile movement;
end bearing. This increases stresses in the bottom portion of the
pile. Hence, there is increase in the monitored strain.
Fig. 3 Time- Axial strain curves of pile model (L15ES)
Fig.4 Time- Axial strain curves of pile model (L25F)
Figure 4 shows the pile strains for pile model (L25F). Here,
the boundary condition at the pile tip does not allow for
developing stresses at the bottom of the clay layer. Hence, the
bottom strains are the least among all locations along the pile.
3.2
Distribution of normal strain and shear stress along the
normalized depth of the pile
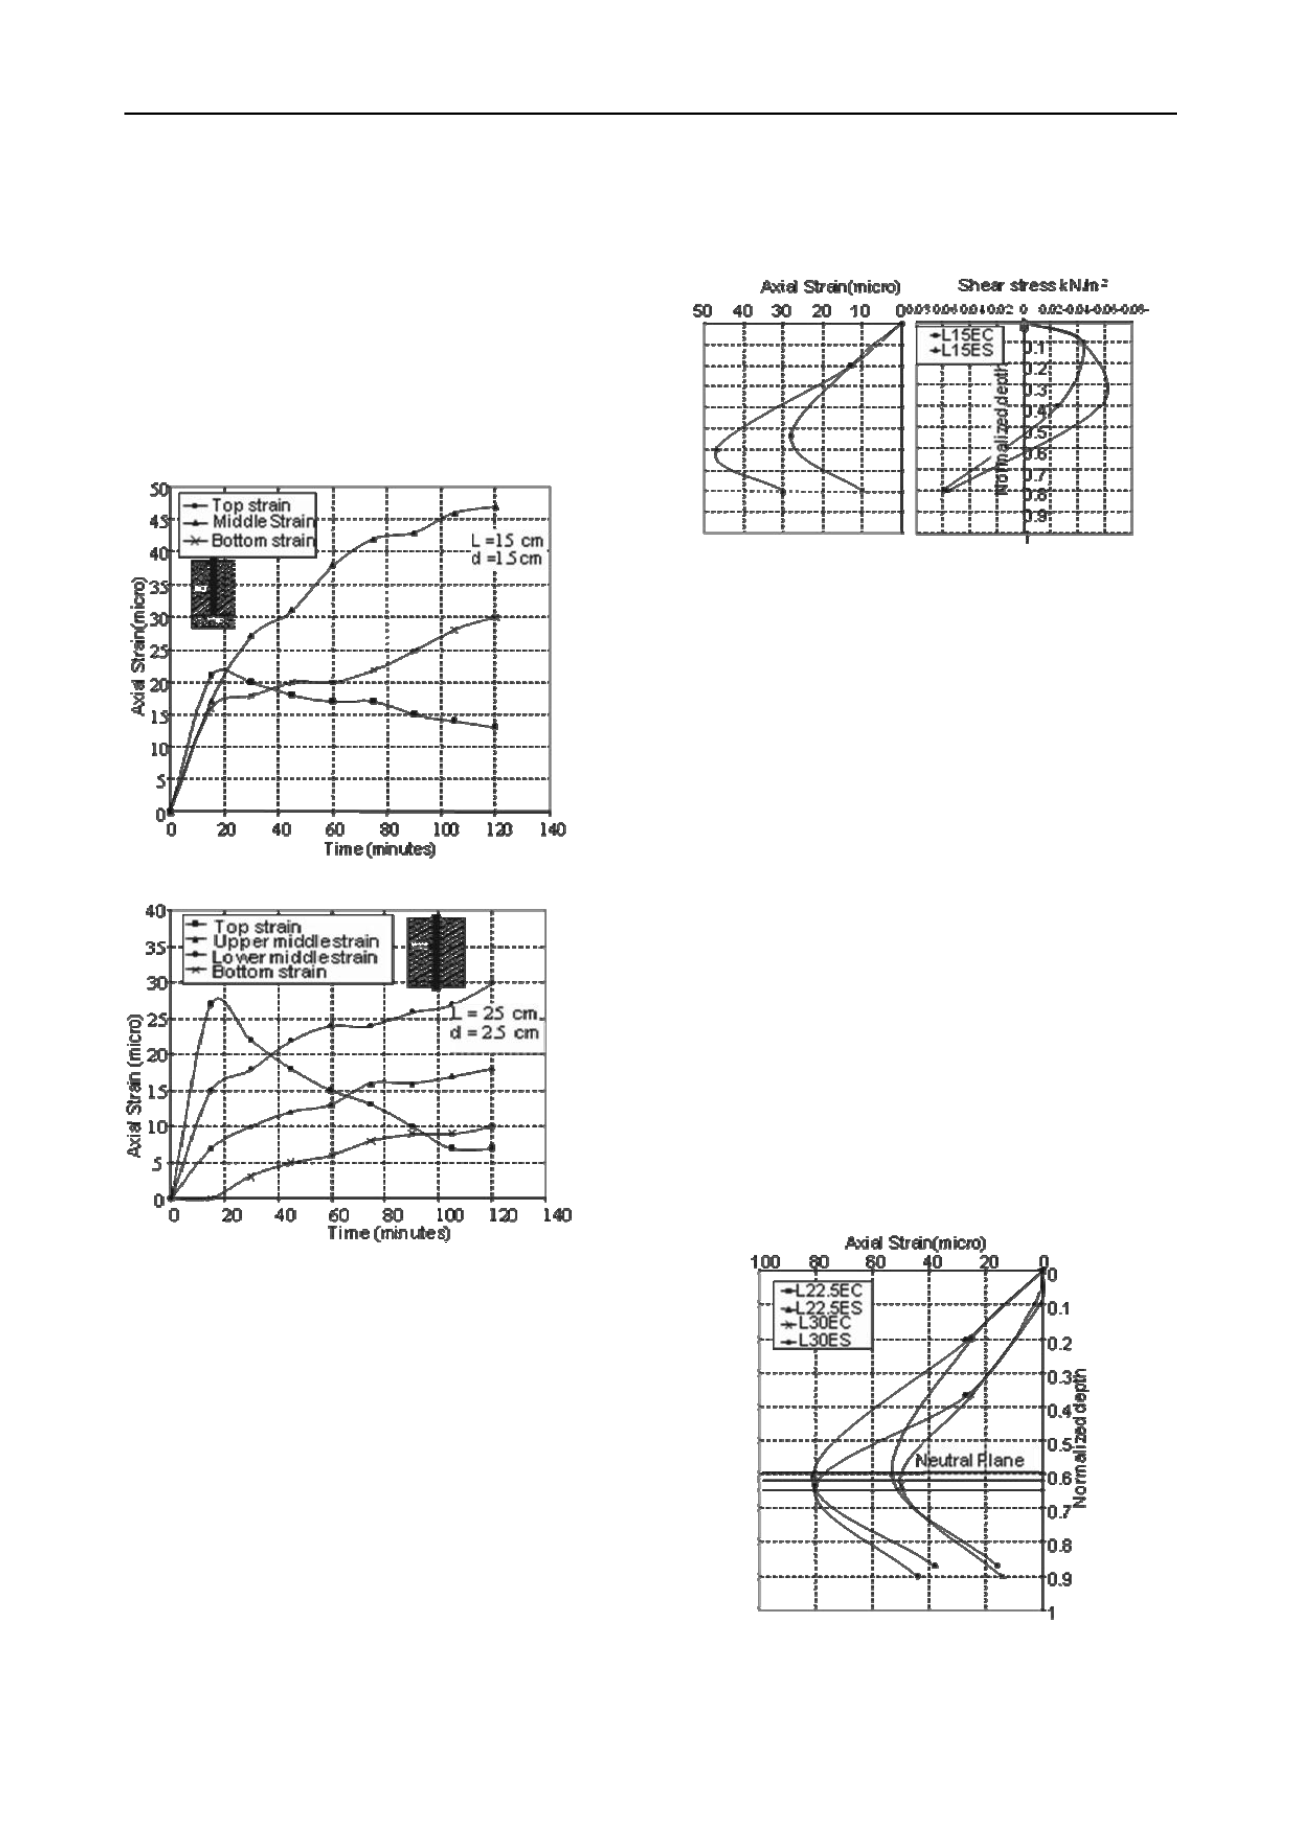
Figure 5 depicts the distribution of normal strain and shear
stress along the normalized depth of the pile models (L15EC
and L15ES). The shown strains are those monitored at the end
of the test. As can be seen from the Figure, small values of
strains are indicated in the upper part where the excess pore
pressure had dissipated, and hence, consolidation process had
decayed. The axial strain increases by the presence of a sand
layer at the pile tip (case II). Strain increases until it reaches a
peak value at an intermediate depth. Then, it decreases. Strain
decrease reflects a decrease in the dragging force. That is the
developing of positive shear resistance along the pile shaft.
Hence, the zone of the peak strain is a transition zone from
negative skin friction to positive skin friction. Obviously, the
neutral plan is located at this peak point.
Fig. 5 Axial strain and shear stress distribution along pile length for
cases (L15EC and L15ES)
The developed shear stress along the pile shaft is calculated from the
monitored strain. Shear stress starts from zero value at the surface of
the soil and increases until it reaches a peak negative value at an
intermediate depth, then it decreases down to zero at the elevation of the
neutral plane where the positive skin friction develops. Neutral plane is
determined where shear stress changes from negative to positive. That
is at the intersection of the curve with the vertical axis. As can be seen
from the Figure the location of the neutral plane is matched from these
two approaches.
As can be seen from Figure 5, the transition of pile ended in
clay is located near to the middle of the pile. The transition
zone of pile ended in sand is located near the pile toe. The
neutral plane is located at the peak point of the transition zone.
In addition, it can be seen that the normalized neutral depth is
(0.53) and (0.61) for the cases of end bearing on clay and sand,
respectively. That is the neutral plane is located closer to the
end of the pile as the base layer gets stiffer.
This observation can be explained based on the simple
equilibrium of vertical forces. (Accumulative negative skin
friction = accumulative positive skin friction + bearing
resistance). Since small-bearing resistance is available for case
I, positive skin friction should be large enough to resist negative
skin friction. Hence, negative skin friction will be reduced with
the neutral plane being located further from the pile tip.
3.3 Effect of the pile length embedded in the clay layer on
the location of neutral plane
Fig. 6 Normalized neutral plane for piles ended in sand and clay (same
L/d)
Figure 6 illustrates the normalized neutral depth as a function to the pile
length embedded in the clay layer. The pile diameter is 1.5cm. Two
cases; I, and II of tested piles are shown in the Figure. As can be seen


