 
          2697
        
        
          Technical Committee 212 /


            Comité technique 212


            i


            M


            i


            E


            M


            i


            i


            E


            ti


            i


            i


            ti


            EK dz z E


            h


            K dz zE


            h


            E


          )(
        
        
          )(
        
        
          1
        
        
          (15)
        
        
          8. Compute E
        
        
          ti
        
        
          c
        
        
          according to equation 12 as follows:


            e


            ni


            i


            i


            i


            M


            i


            E


            D


            ti


            e


            c


            ti


            D


            hEK


            dz zE


            D


            E


            e


          1
        
        
          0
        
        
          )(
        
        
          1
        
        
          (
        
        
          16)
        
        
          9. Compute the transfer length L
        
        
          0
        
        
          by equation 11.
        
        
          10. Compute the effective embedded length D
        
        
          e
        
        
          of the pile based
        
        
          on equation 10. If L
        
        
          0
        
        
          leads to D>D
        
        
          e
        
        
          (flexible pile), repeat steps 4
        
        
          to 10 along an iterative process until the convergence of K
        
        
          R
        
        
          .
        
        
          11. Compute the values of E
        
        
          ti
        
        
          and P
        
        
          u
        
        
          for each segment according
        
        
          to equations (3) and (4) respectively.
        
        
          12. Use a PC software to analyze the load-deflection response
        
        
          of the pile on the basis of the P-Y curves so built. SPULL
        
        
          (Single Pile Under Lateral Loads) developed at the University
        
        
          of Blida is a freeware available upon request sent by E-mail to
        
        
          the author.
        
        
          4  VALIDATION OF THE METHOD
        
        
          Lateral load-deflection response of some case studies reported
        
        
          in the literature was predicted. Piles are identified as mentioned
        
        
          in their references.
        
        
          Five full-scale lateral loading tests in sandy soils were
        
        
          studied according to the proposed method.
        
        
          The Lock & Dam 26 site is composed of alluvial deposits
        
        
          (poorly graded sand) 3 m thick and overlying glacial deposits
        
        
          (medium to coarse sand with gravel) 17 m thick. The bedrock is
        
        
          a hard limestone from the Mississipian age. Lateral load tests
        
        
          were performed on two identical HP-14x73 piles socketed in the
        
        
          limestone bedrock, jacked apart, and the lateral displacements
        
        
          of each pile were measured.
        
        
          The Longjuemau site is located near Paris and composed of a
        
        
          tertiary silty fine sand, rather uniformly graded. Piles TG and
        
        
          TD are driven and loaded as in the above site.
        
        
          The Roosevelt bridge site is composed of loose layer of sand
        
        
          thick of 4 m, overlying a thick layer of very dense partially
        
        
          cemented sand. The site was submerged by water up to 2 m
        
        
          above the ground level. Square prestressed concrete pile was
        
        
          driven and tested up to cracking under a load of 200 kN and
        
        
          concrete failure occurred under a load of 320 kN.
        
        
          Figure 2 shows remarkable fluctuation of the 35 points of
        
        
          comparison around the ratio predicted to measured ground
        
        
          deflection of 1.11. Moreover, Y
        
        
          0
        
        
          pred.
        
        
          /Y
        
        
          0
        
        
          meas.
        
        
          has a mean value of
        
        
          1.22 and a coefficient of variation of 21%.
        
        
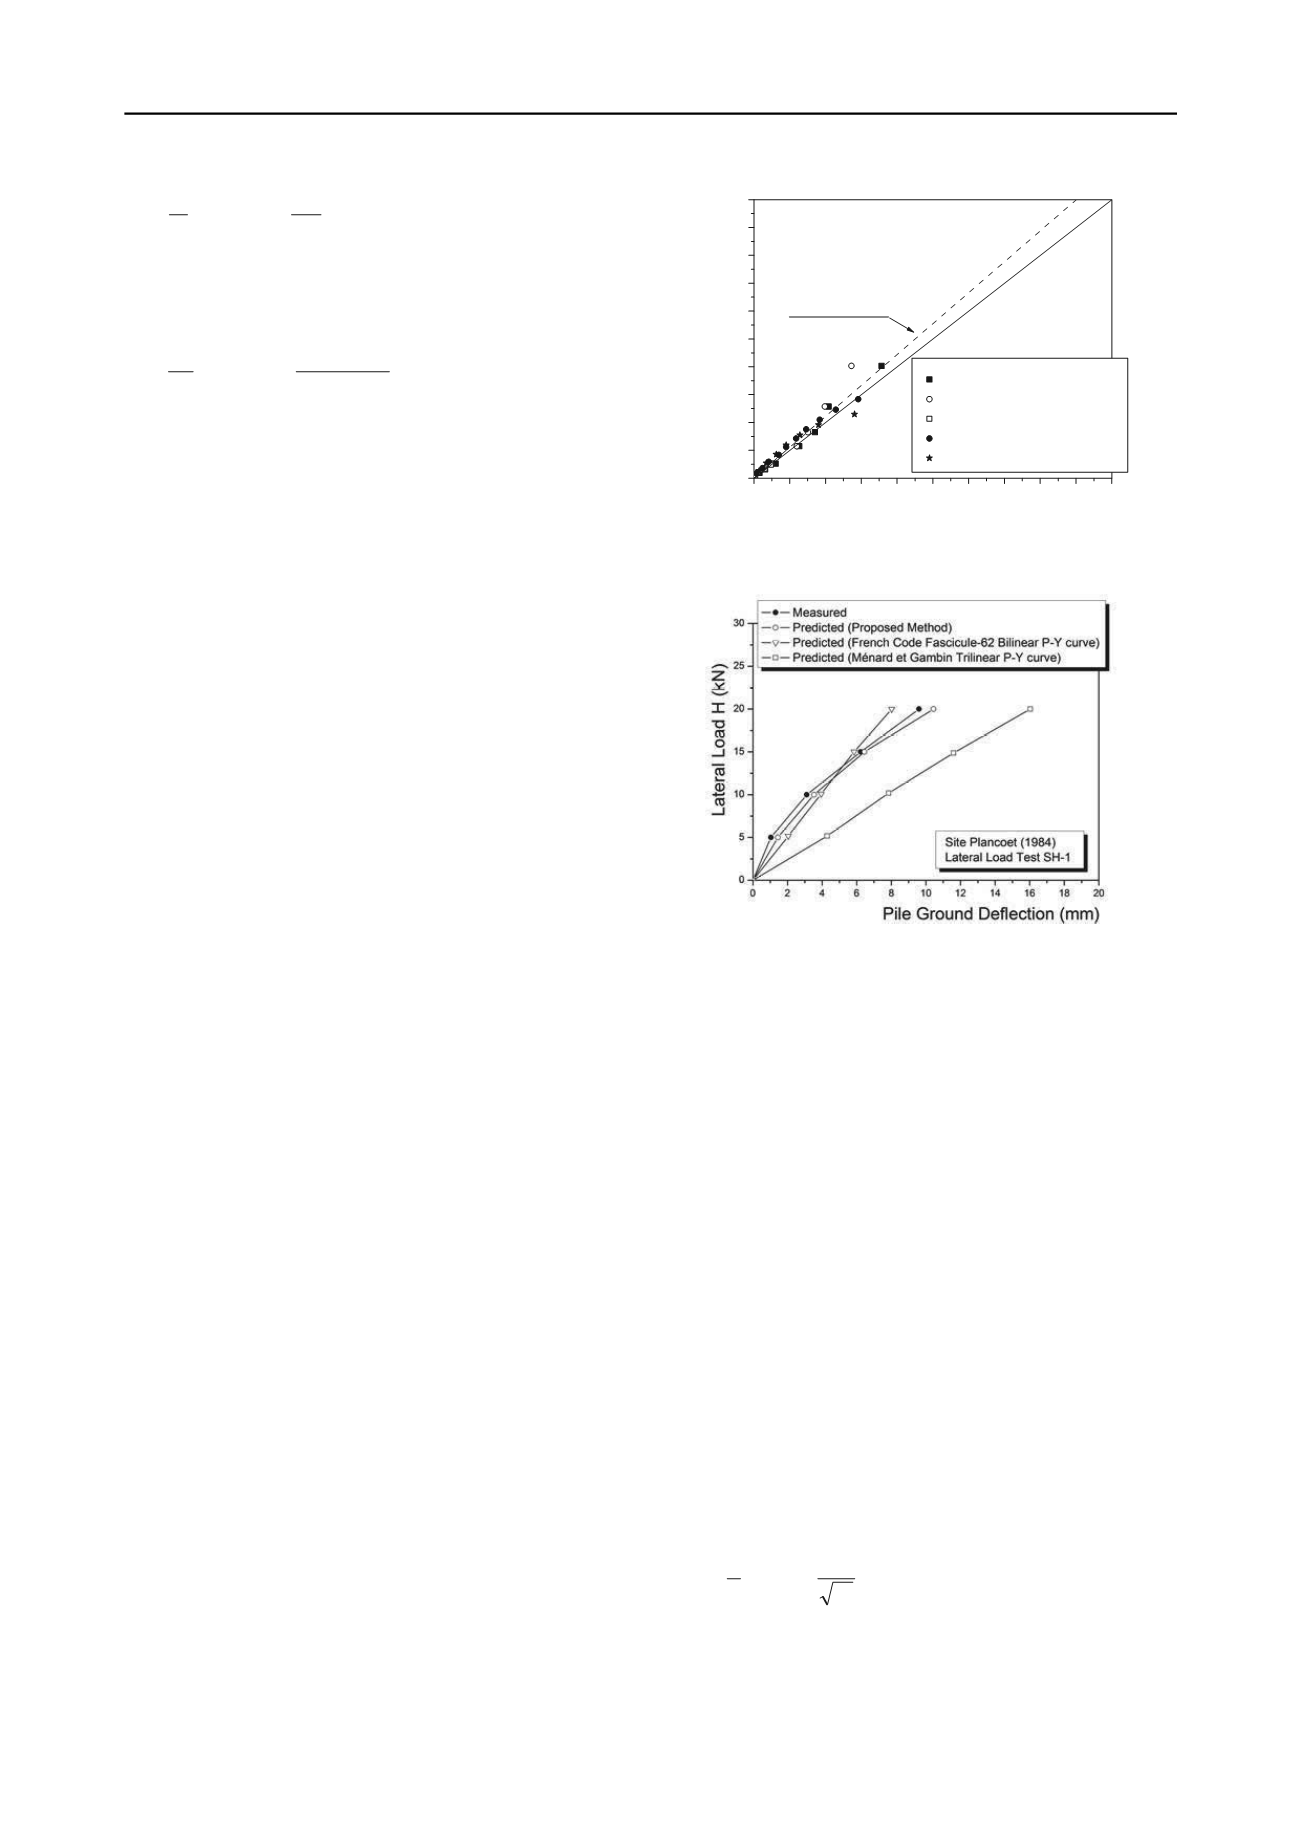
          The experimental site located in Plancoët (Côtes-du-Nord,
        
        
          France) is a bi-layered soil composed of a clay (CL) thick of 4
        
        
          m overlying  a layer of sand (SM) thick of 4 m. The test pile is a
        
        
          driven rectangular pipe with 0.284 m of width and an embedded
        
        
          length of 6.5 m.
        
        
          As shown in figure 3, very good agreement is noticed
        
        
          between the measured pile ground deflections and the ones
        
        
          predicted by the proposed method. The P-Y curves of Ménard
        
        
          and Gambin led to very pessimistic prediction (Hadjadji et al,
        
        
          2002). The P-Y curves of the French code Fascicule-62
        
        
          however overpredicted at small deflections and then
        
        
          underpredicted at larger deflections (Hadjadji et al, 2002).
        
        
          Moreover, two other multi-layered experimental sites were
        
        
          studied.
        
        
          Figure 2. Comparison of predicted and measured deflections in sand
        
        
          0 5 10 15 20 25 30 35 40 45 50
        
        
          0
        
        
          5
        
        
          10
        
        
          15
        
        
          20
        
        
          25
        
        
          30
        
        
          35
        
        
          40
        
        
          45
        
        
          50
        
        
          Y
        
        
          0
        
        
          /B predicted  %
        
        
          Y
        
        
          0
        
        
          /B measured  %
        
        
          Lock & Dam, Pile 3-12
        
        
          Lock & Dam, Pile 3-13
        
        
          Roosevelt bridge, Pile 16
        
        
          Longjumeau, Pile TG
        
        
          Longjumeau, Pile TD
        
        
          Y
        
        
          pred.
        
        
          0
        
        
          /Y
        
        
          meas.
        
        
          0
        
        
          =1,11
        
        
          (R
        
        
          2
        
        
          =94%)
        
        
          Figure 3. Comparison of predicted and measured deflections in
        
        
          bilayered soil
        
        
          The first one is located in Vallée de Voulzie (Provins,
        
        
          France) and composed of 14 m de silt overlying 2.5 m of
        
        
          gravelly sand and then a layer of  soft chalk becoming hard in
        
        
          depth. The test pile is a vibratory driven pipe having an outside
        
        
          diameter of 0.93 m and an embedded length of 23 m.
        
        
          The second site is located in Livry-Gargan (France) and
        
        
          composed of clayey sand thick of 4 m, followed by a layer of
        
        
          marl thick of 10 m then a deep layer of chalk. The test pile is a
        
        
          bored pipe having an outside diameter of 0.7 m and an
        
        
          embedded length of 20 m (Moussard and kersale, 2011).
        
        
          As illustrated by figure 4, the pile ground deflections were
        
        
          accurately predicted by the proposed method. The results of
        
        
          of
        
        
          f the
        
        
          Equation 6 may be reformulated in case of a solid circular pile
        
        
          embedded in a homoge
        
        
          combining equations 6 and
        
        
          predictions are encouraging seeing the multitude
        
        
          approximations made during the process of definition o
        
        
          method.
        
        
          5  ANALYSIS OF THE FEATURES OF THE METHOD


            5.1. The modulus number


          neous soil. For example, in sandy soils,
        
        
          8 leads to:


            K


            BD K


            E


          1 ) / (
        
        
          2
        
        
          3
        
        
          2


          (17)
        
        
          where K = E
        
        
          p
        
        
          /E
        
        
          c
        
        
          is the  pile/soil  compressibility. This equation
        
        
          shows  that  the  modulus  number  increases  with  the  pile
        
        
          slenderness ratio and decreases with the pile/soil
        
        
          compressibility.