2688
Proceedings of the 18
th
International Conference on Soil Mechanics and Geotechnical Engineering, Paris 2013
(Rosa 2000), revised to correlate static ultimate loads to CASE-
dynamic ultimate loads (Bilfinger 2002).
Table 1. Moments of the distribution of R = log (P
OBS
/P
D&Q
) from two
ifferent sources
d
Source
Mean
Variance
40 static load tests (original)
0.00610
0.01538
189 dynamic load tests reinterpreted
0.04157
0.04330
Figure 1 is a graphical representation of the distribution
associated with the second line of Table 1.
-0,40000 -0,20000 0,00000 0,20000 0,40000
0
5
10
15
20
25
Frequency
Mean = 0,0415737
Std. Dev. =
0,20808842
N = 189
R=log(Pobs/Pprev)
D&Q Method
Figure 1. Distribution of R = log (P
OBS
/P
D&Q
)
It is interesting to note that the variance of the original
results used to develop the method is significantly lower than
that associated with databases compiled from regular job sites.
One can speculate that boreholes and tested piles were probably
much closer to each other for the original formulation, so that
intra-site variance was negligible. Moreover, the correlation
between static and dynamic load tests adds to the uncertainty in
the second database of Table 1. In any case, the higher
coefficient of variation of P
OBS
/P
D&Q
in the second database
(61.7%) is not incompatible with equivalent results found by
other researchers: Briaud and Tucker (1988) published the
results of 98 static pile load tests and showed that the coefficient
of variation of P
OBS
/P
PRED
, for 12 different ultimate load
prediction methods (using SPT, CPT, PMT and direct shear
strength tests) varied between 42% and 74%.
For this reason, it seems reasonable to assume that ultimate
load prediction methods based on industry-standard site
investigation plans are prone to exhibiting high variability and
could, therefore, benefit from information gathered during the
pile driving operation itself.
4 FIELD CONTROL METHODS
Only a limited number of piles are usually subject to dynamic
monitoring and testing. For the vast majority, field control
methods are the only tools the engineer has at his disposal to
check if the piles are being adequately driven.
Field control methods have been used since the early days of
pile driving, and the best known is the set, the permanent
settlement due to a hammer blow. There are a number of the so
called pile driving formulas, which basically equate the energy
delivered by the pile driving equipment to the work done by the
soil forces that resist pile penetration.
Terzaghi (1943) thus expressed his realistic opinion about
the relevance of those formulas:
In spite of their obvious
deficiencies and their unreliability, pile driving formulas still
enjoy great popularity among practicing engineers, because the
use of these formulas reduces the design of a pile foundation to
a very simple procedure.
The number of technical papers on
such formulas is indeed significant; after all, it is also relatively
easy to obtain field data. Even if some published results show
good correlation between estimated and measured ultimate
loads, the universal use of any particular formula must be
questioned: pile length, pile diameter, hammer types,
operational practices, soil types, to name a few, are factors
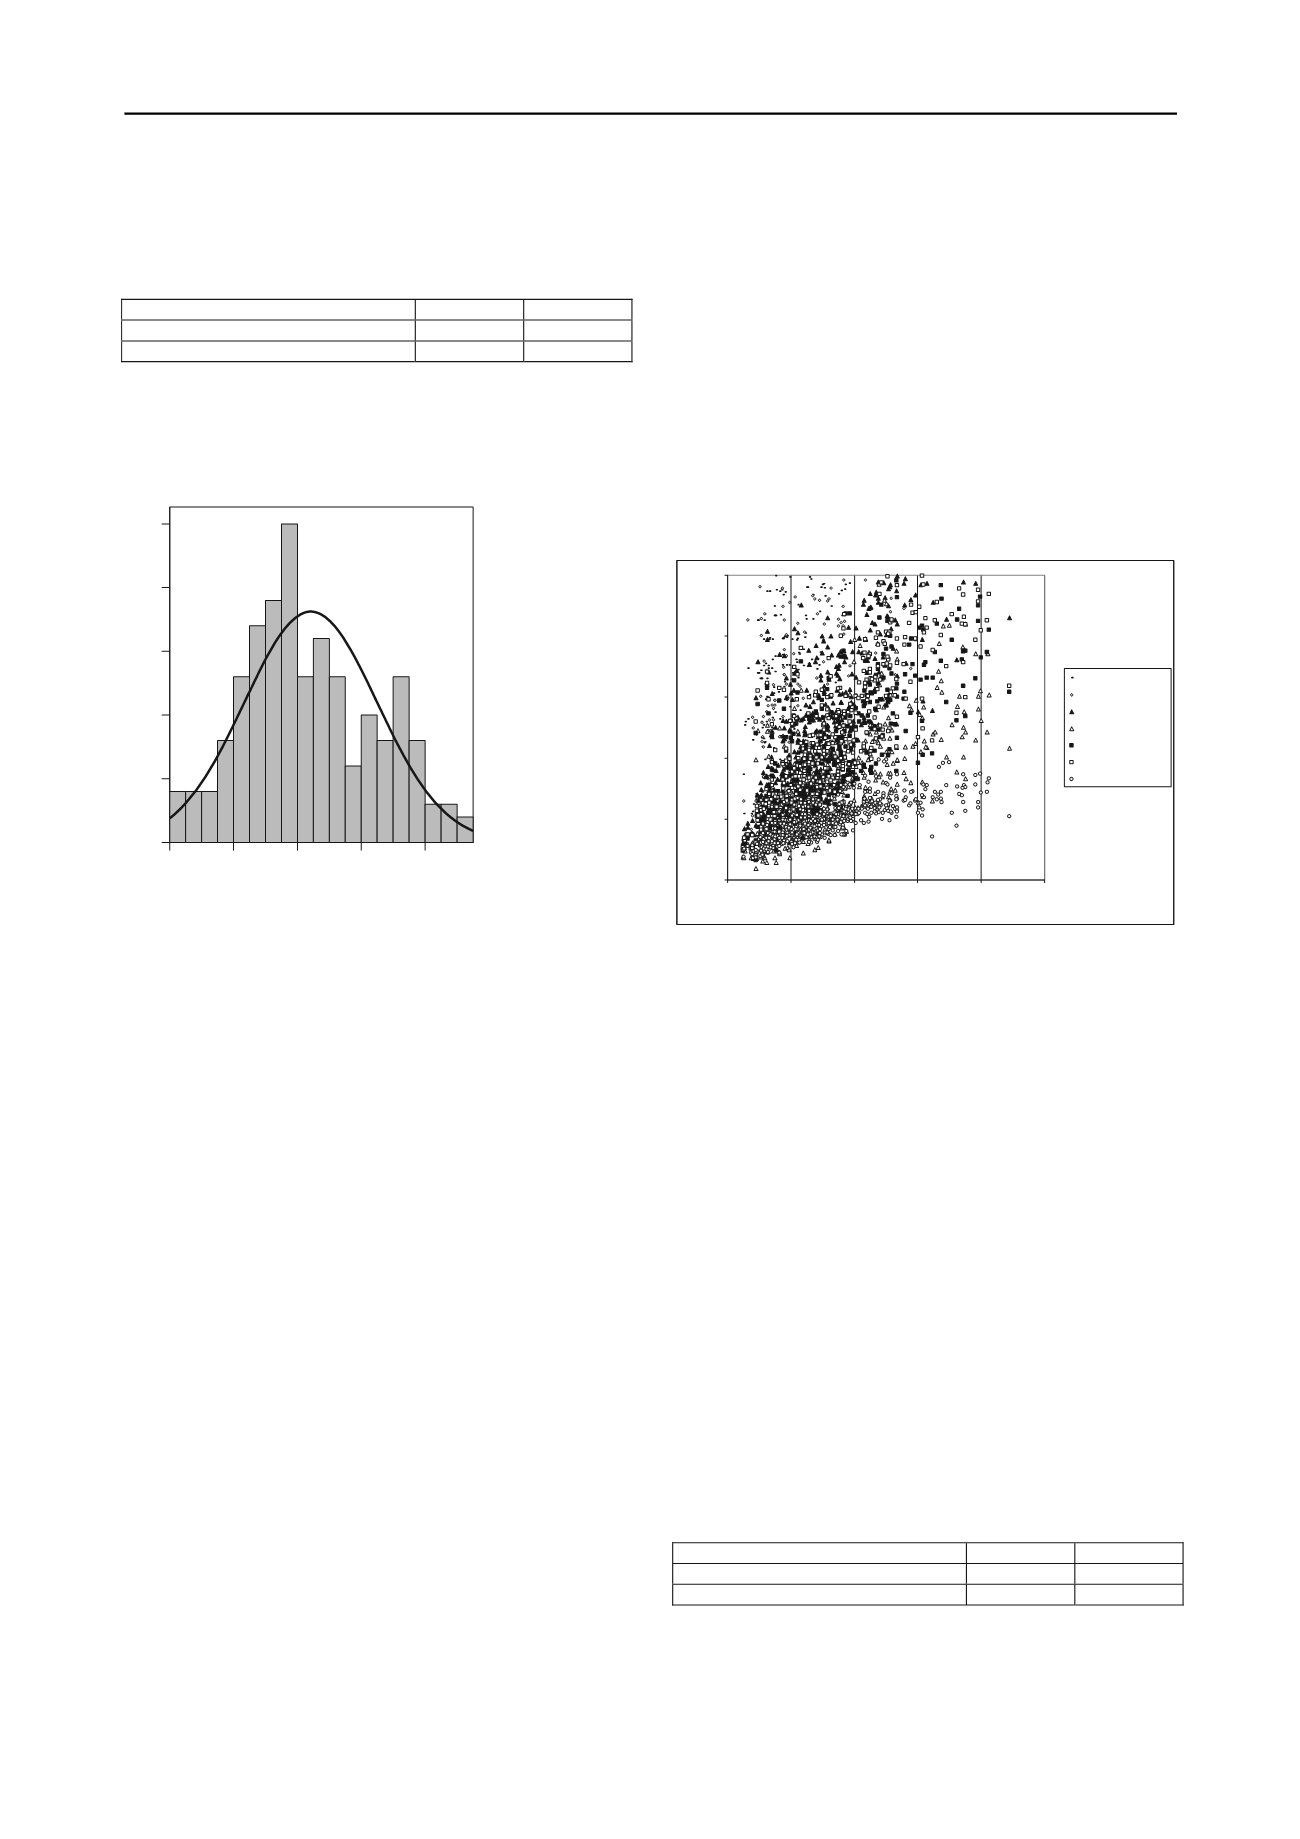
which have significant impacts on the results. Figure 2 presents,
for the database made available by Rosa (2000), the comparison
of ultimate loads obtained by dynamic load tests and those
predicted on the basis of some of the most popular (Poulos and
Davis 1980) set-based pile driving formulas: Engineering News,
Eytelwein (or Dutch), Weisbach, Hiley, Janbu, Danish and
Gates. The scatter speaks for itself.
0
1000
2000
3000
4000
5000
0
1000
2000
3000
4000
5000
Dynamic Load Test (KN)
Driving Formula bearing capacity prediction (KN)
Engineering News
Eytelwein
Weisbach
Hiley
Janbu
Danish
Gates
Figure 2. Comparison between measured and estimated bearing
capacities using set-based dynamic formulas.
Janbu’s formula led to the best correlation and the moments
of the variable log(P
OBS
/P
CTL
), where CTL=Janbu, are
presented in table 2.
Rebound, the elastic deformation caused by a hammer blow,
is being increasingly used as a pile driving field control. The
basic idea is to use the pile itself as a dynamometer that
measures soil resistance to driving, but it is sometimes difficult
to distinguish pile rebound from soil rebound. Moreover,
measuring rebound requires continuous pile displacement
recording during driving, which is more complicated than set
measurement.
Figure 3 presents, for the database made available by Rosa
(2000), the comparison of ultimate loads obtained by dynamic
load tests and those predicted on the basis of two of the most
popular (Aoki and Alonso 1989) rebound-based pile driving
formulas: Chellis and Uto. In addition, it presents similar results
for Rosa’s modification of the Chellis formula (Rosa 2000).
Comparison of the scatter in Figures 2 and 3 suggests that
rebound-based formulas are more precise than set-based
formulas. This is confirmed by the variances in Table 2. Also,
the coefficient of variation of P
OBS
/P
JANBU
is 69.8%, while that
of P
OBS
/P
CHELLIS
is 45.0%.
Table 2. Moments of the distribution of log (P
OBS
/P
CTL
) for two different
ormulas
f
Pile driving formula
Mean
Variance
CTL=Janbu (set-based)
-0.01819
0.02657
CTL=Chellis (rebound-based)
0.01818
0.01113


