2852
Proceedings of the 18
th
International Conference on Soil Mechanics and Geotechnical Engineering, Paris 2013
minimize friction between the tank wall and sand
particles.
Vertical loads were applied to the model pile by
using a hydraulic jack. The magnitudes of applied loads
were recorded with the help of a pre-calibrated sensitive
proving ring. The lateral load was affected through a 2
mm diameter high-tension steel wire connected to the
pile cap using an eye bolt. The other side of the wire ran
over smooth adjustable pulley with a 70 mm diameter
and supported a load plat form. In order to record the
correct vertical settlement and lateral deflection of the
pile for each load increment applied, four sensitive dial
gauges of the least measurement of 0.01 mm were used,
two for vertical and two for lateral and their average was
taken.
A smooth steel model pile, with diameter of
10mm, and total length 110, 210, 310, and 410 mm were
used in this study. The upper 10 mm of the pile is
screwed part and the other length embedded in sand. The
slenderness ratio (L/D) was chosen to be used in this
research equal to 10, 20, 30, and 40. Five strain gages
were stuck to the surface of the model pile with L/D =
40. The measurement of flexural strains can lead directly
to bending moment curve.
The cap was designed as flexible as possible and
the pile was not deeply seated through it, so that no
restraint of the pile head rotation is available. One edge
of the cap is bent up to allow horizontal dial gauges to be
mounted. At the other side of the cap, a 1.5-cm hook was
welded exactly at the center of this side.
3 SOIL PROPERTIES
The soil used in this study for all of the tests is clean
sand, classified as poorly graded sand according to the
Unified Soil Classification System. The moisture content
(W
c
) was about 2%. The following are the results of the
sieve analysis test; effective grain size D
10
= 0.14 mm
and uniformity coefficient C
u
= 4.357. The sand was
placed to achieve three relative densities. The physical
characteristics of these soils are shown in Table (1).
Table 1. Physical Properties of the Tested Soils.
Soil Condition A B C
Relative density D
r
(%) 25 45 68
Unit weight (kN/ m
3
) 17.5 17.8 18.3
Voids ratio (e) 0.56 0.52 0.48
Porosity (n) 0.36 0.34 0.33
Angle of shearing resistance (Ø) 31
o
34
o
38
o
4 PREPARATION OF EXPERIMENTAL SETUP
Before sand slope preparation, the model pile was then
placed at a specific position. Then, model sand slope
150- mm high with slope angle, θ, of 26.56
o
(2H: 1V)
was prepared in layers of 50 mm thick. The proposed
testing geometry of the slope was first marked on the
walls of the tank for reference. To obtain uniform density
of the soil in the tank, controlled pouring and tamping
techniques using a flat bottom hammer were applied. The
pile was placed and fixed in its correct position before
the formation of sand slope to simulate non displacement
piles.
5 RESULTS AND DISCUSSION
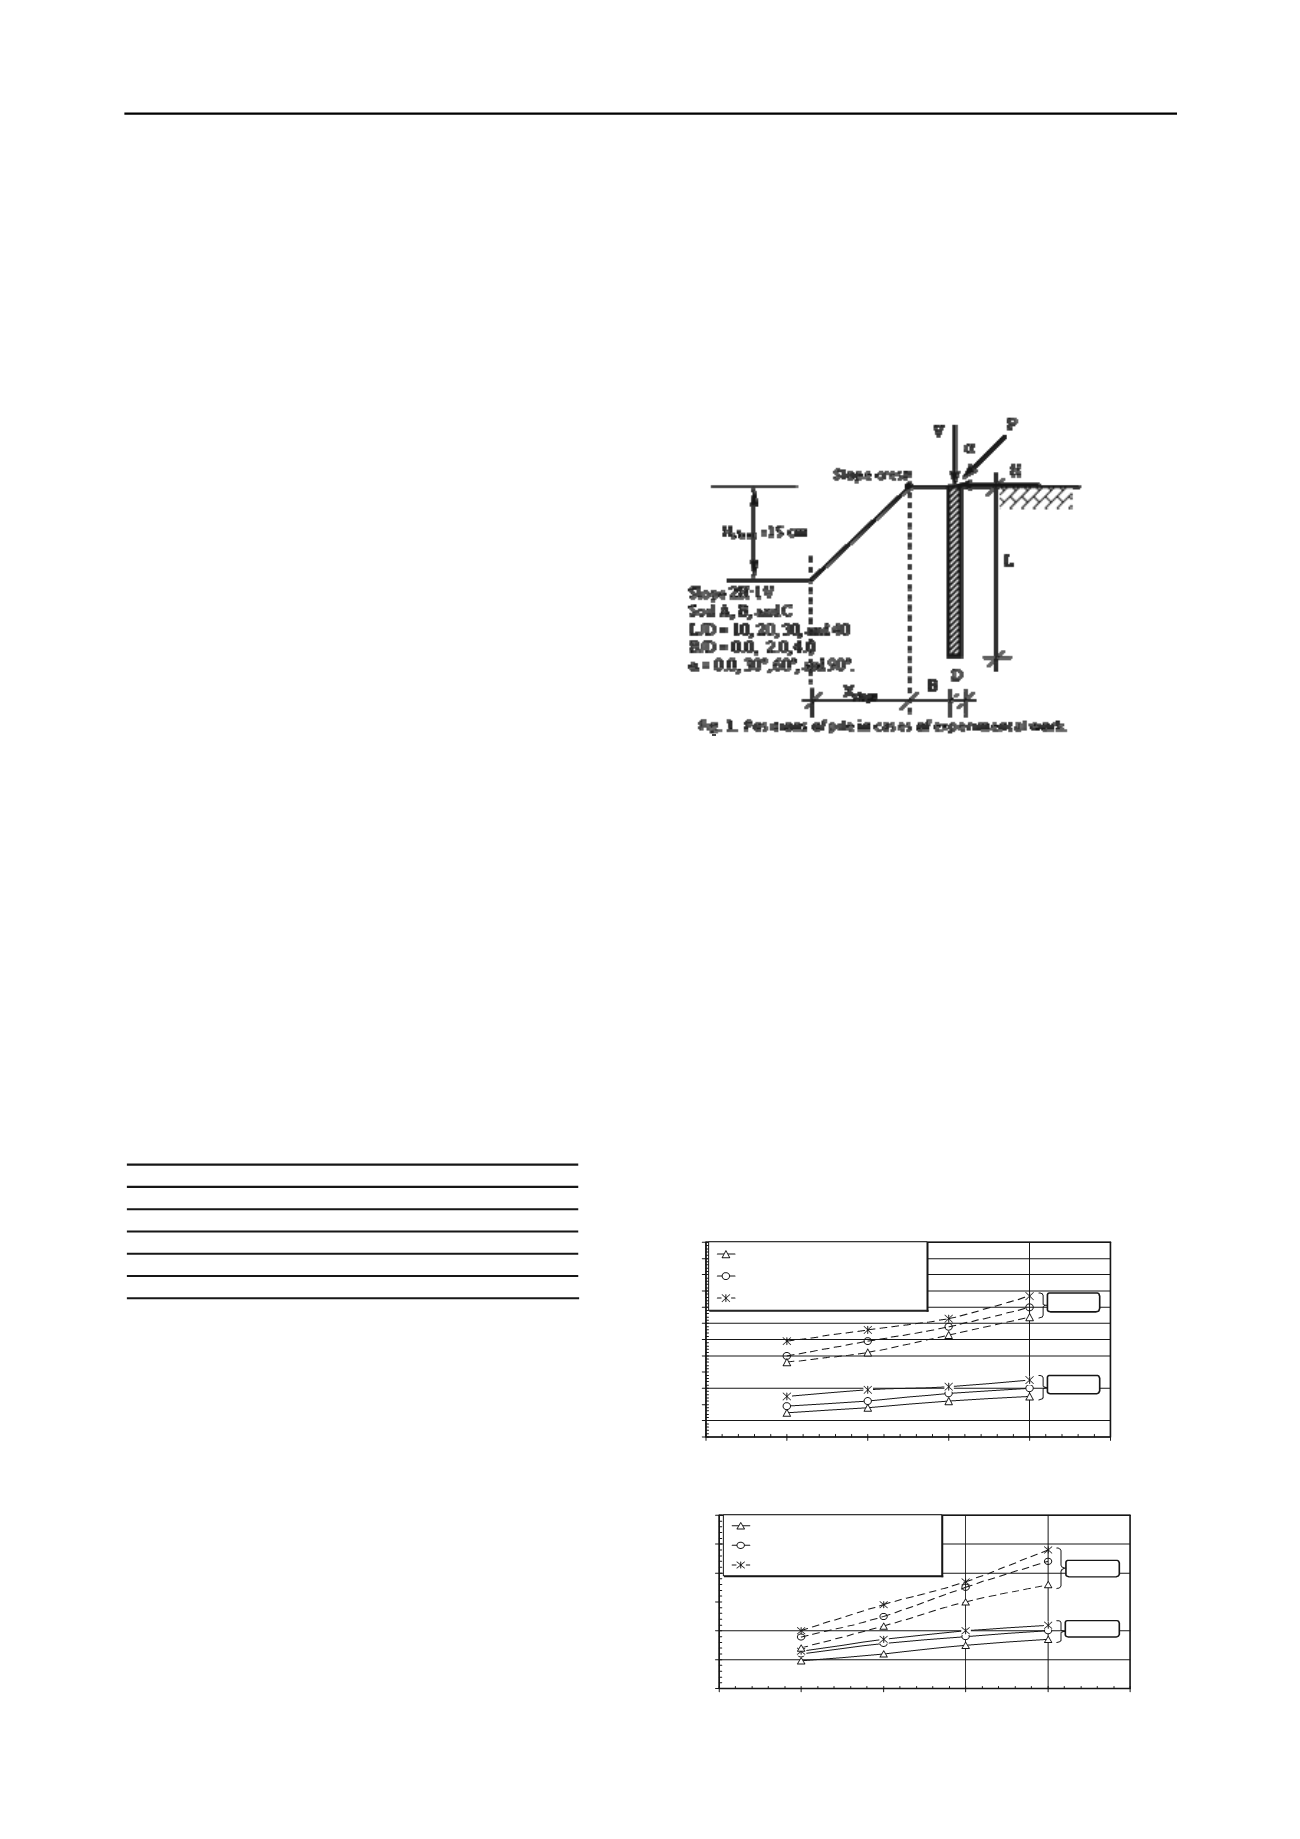
An experimental testing program was designed to study
the effect of inclined load on the behavior of vertical pile
in sand on level ground and adjacent to ground slope.
The geometry of the problem is illustrated in Fig. 1. As
shown in this figure, the height of ground slope (H
slope
)
equal to 15 cm and its horizontal projection (X
slope
) equal
to 30 cm to achieve slope gradient (2H:1V). The location
of the pile relative to the slope crest is the distance (B).
The load-deflection curves were obtained by plotting the
relationship between the vertical and lateral loads and its
axial settlement and lateral deflections, respectively.
According to Terzaghi (1942) and Tomilson (1980), the
ultimate axial (V
u
) and lateral (H
u
) loads are defined as
the loads, which cause a vertical or horizontal deflection
of one tenth of the pile diameter (i.e. 10% of the pile
diameter) to simulate the geotechnical failure in the soil.
5.1
Ultimate capacity of pile in the level ground
The ultimate axial load and lateral load of the pile
increased during testing program when the slenderness
ratio (L/D) was increased. As shown in Fig. 2, for dense
sand (soil C), a significant increase for ultimate axial
load (V
u
) with increasing slenderness ratio. But for loose
sand (soil A), the effect of slenderness ratio on the
ultimate axial load found to be small. The ultimate axial
load (V
u
) decreased as the inclination of the applied load
with the vertical (α) was increased.
0
10
20
30
40
50
60
70
80
90
100
110
120
0
10
20
30
40
50
L/D
Ultimate axial load Vu (N)
Angle of inclined load = 60 degree
Angle of inclined load = 30 degree
Angle of inclined load = 0.0 degree
Soil (A)
Soil (C)
Fig. 2. Relationship between (L/D) and (V
u
) for soil A and C.
0
10
20
30
40
50
60
0
10
20
30
40
50
L/D
Ultimate lateral load Hu (N)
Angle of inclined load = 90 degree
Angle of inclined load = 60 degree
Angle of inclined load = 30 degree
Soil (A)
Soil (C)
Fig. 3. Relationship between (L/D) and (H
u
) for soil A and C.
minimize friction between the tank wall and sand
particles.
Vertical loads were applied to the model pile by
using a hydr ulic jack. The magnitudes of app ied loads
were recorded with the lp of a pre-calibrated sensitive
proving ing. The lat ral load was affected through a 2
mm diameter igh-t nsion steel wir connected to the
pile c p using an eye b lt. Th other side of the wire ran
over smooth djusta le pull y with a 70 mm d ameter
and upported a load plat form. In order to record the
correct vertical settlement and lateral deflection of the
pil for ach oad incr ment applied, four sensitive dial
gauges of the least m asurement of 0.01 mm wer used,
two for vertical and two for lateral and their av age was
taken.
A smooth steel model pile, with diameter of
10mm, and t tal length 110, 210, 310, and 410 mm were
used in this study. The upper mm of the pil is
crewed part an the other length embedded in sand. The
sl nderness ratio (L/D) was c osen to be u ed in this
r sea ch equal to 10, 20, 30, and 40. Five train gages
w re stuck to he surface of the model pile w th L/D =
40. The measur ment of flexural strains can lead directly
to bending moment curve.
The cap was designed as flexible as possible and
the pile was not de ply seated through it, o that no
r straint of the pil head rotation is available. One edge
of the cap is bent up to all w horizont l dial gaug s to be
mounted. At the other side of the cap, a 1.5-cm hook was
weld exactly a the center of this side.
3 SOIL PROPERTIES
The soil used in this study for all of the tests is clean
sand, clas ified as poorly graded sand according to the
Unified Soil Cl sification System. The m isture c ntent
(W
c
) was about 2%. The following are the results of the
sieve nalysis test; eff ctive grain size D
10
= 0.14 mm
and u iformity co fficient C
u
= 4.357. The sand was
placed to achieve thre relative densities. The physical
charac eristics of t es soi s ar shown in Tabl (1).
Table 1. Physical Properties of the Tested Soils.
Soil Condition A B C
Relative density D
r
(%)
25
45
68
Unit weight (kN/ m
3
)
17.5 17.8 18.3
Voids ratio (e)
0 6 0 52 0.48
Porosity (n) 0.36 0.34 0.33
Angle of shearing resistance (Ø) 1
o
o
38
o
4 PREPARATION OF EXPERIMENTAL SETUP
Before sand slope preparation, the model pile was then
plac d t a specific ositi . Then, mode sand slope
150- mm high w th slope angle, θ of 26.56
o
(2H: 1V)
was prepared in layers of 50 mm thick. The proposed
te ting geometry of the slope was first marked on the
walls of the tank for referenc . To obtain uniform density
of the soil in the tank, controlled pouri g and tamping
tec niques using a flat b ttom hammer were applied. The
pile was placed and fixed in its co rect position before
th formation of sand slope to imulate non d splac ment
piles.
5 RESULTS AND DISCUSSION
An experimental testing program was designed to study
the eff ct of inclined load n the behavior of vertical pile
in sand n level ground and adjacent t ground slope.
The ge metry of the problem is illustrated in Fig. 1. As
shown in his igure, the height of g ound slope (H
slope
)
equal to 15 cm and its horizon al projection (X
slope
) equal
to 30 cm to achieve lope gradient (2H:1V). The location
f the pile relati to th slope crest is the distance (B).
The load-deflection curves were obtained by plotting the
relationship be ween th vertical and lateral loads and its
axial ettlement and lateral deflections, respectively.
According to Terzaghi (1942) and T milson (1980), the
ultimate axial (V
u
) and lateral (H
u
) load are defined as
the loads, which c use vertical or horizontal defl ction
of ne tent of the pile diamete (i.e. 10% of the pile
diam ter) to simulate the geot chnical failure in so .
5.1
Ultimate capacity of pile in the level ground
The ultimate axial load and lateral load of the pile
increased during testing progr m when the slenderness
ratio (L/D) was increased. As sho n i Fig. 2, for d n e
sand (soil C), a significant increase for ultimate axial
load (V
u
) with increasing sle derness ratio. But for loose
s nd (soil A), the effect of slenderness rati on the
ultimate axial load found to be small. The ultimate axial
oad (V
u
) decre sed as the inclination of the applied load
with the vertical (α) was increased.
0
10
20
30
40
50
60
70
80
90
100
110
120
0
10
20
30
40
50
L/D
Ultimate axial load Vu (N)
Angle of inclined load = 60 degree
Angle of inclined load = 30 degree
Angle of inclined load = .0 degree
Soil (A)
Soil (C)
Fig. 2. Relationship between (L/D) and (V
u
) for soil A and C.
0
10
20
30
40
50
60
0
10
20
30
40
50
L/D
Ultimate lateral load Hu (N)
Angle of inclined load = 90 degree
Angle of inclined load = 60 degree
Angle of inclined load = 30 degree
Soil (A)
Soil (C)
Fig. 3. Relationship between (L/D) and (H
u
) for soil A and C.


