2826
Proceedings of the 18
th
International Conference on Soil Mechanics and Geotechnical Engineering, Paris 2013
4. CONCLUSIONS
The available as-built records for test pile TP-03 indicated
the presence of a number of anomalies associated with the
construction of the pile which were likely to affect the results of
the pile load test. It is possible that these anomalies were due to
the entrapment of water during pile construction. The anomalies
included an irregular pile shape due to zones of over-break, the
largest of which was assessed to be present at a depth of about
35 m, and possible necking of the pile at a depth of about 25 m.
Based on the results of the Koden tests, it was assessed that the
pile profile changed in verticality from near vertical to about
1(H):10(V) at a depth of about 37 m. It would appear that this
anomaly was removed by further pile excavation, as the
concreting records show that the casing was lowered to the pile
toe.
The sonic tomography plots indicated that the concrete
quality along 70% of the pile length was reasonable. The
concrete quality in the section of the pile within the soft rock
varied and it was considered that water entrapment may have
occurred as a result of the casing being lowered to the base of
the pile at the start of concreting. The measured drop in the
concrete level resulting from the extraction the first section of
casing was less than that expected to account for the over-break
in the socket. It was therefore considered that the bond at the
soft rock-concrete interface may be affected. The assessed 4 m
long section of poor quality concrete at a depth of about 25 m
was attributed to the large concrete level drop recorded during
construction of the pile and possible contamination of the
concrete by spoil at the top of the concrete column. This feature
may also indicate necking of the pile via a reduced pile
diameter.
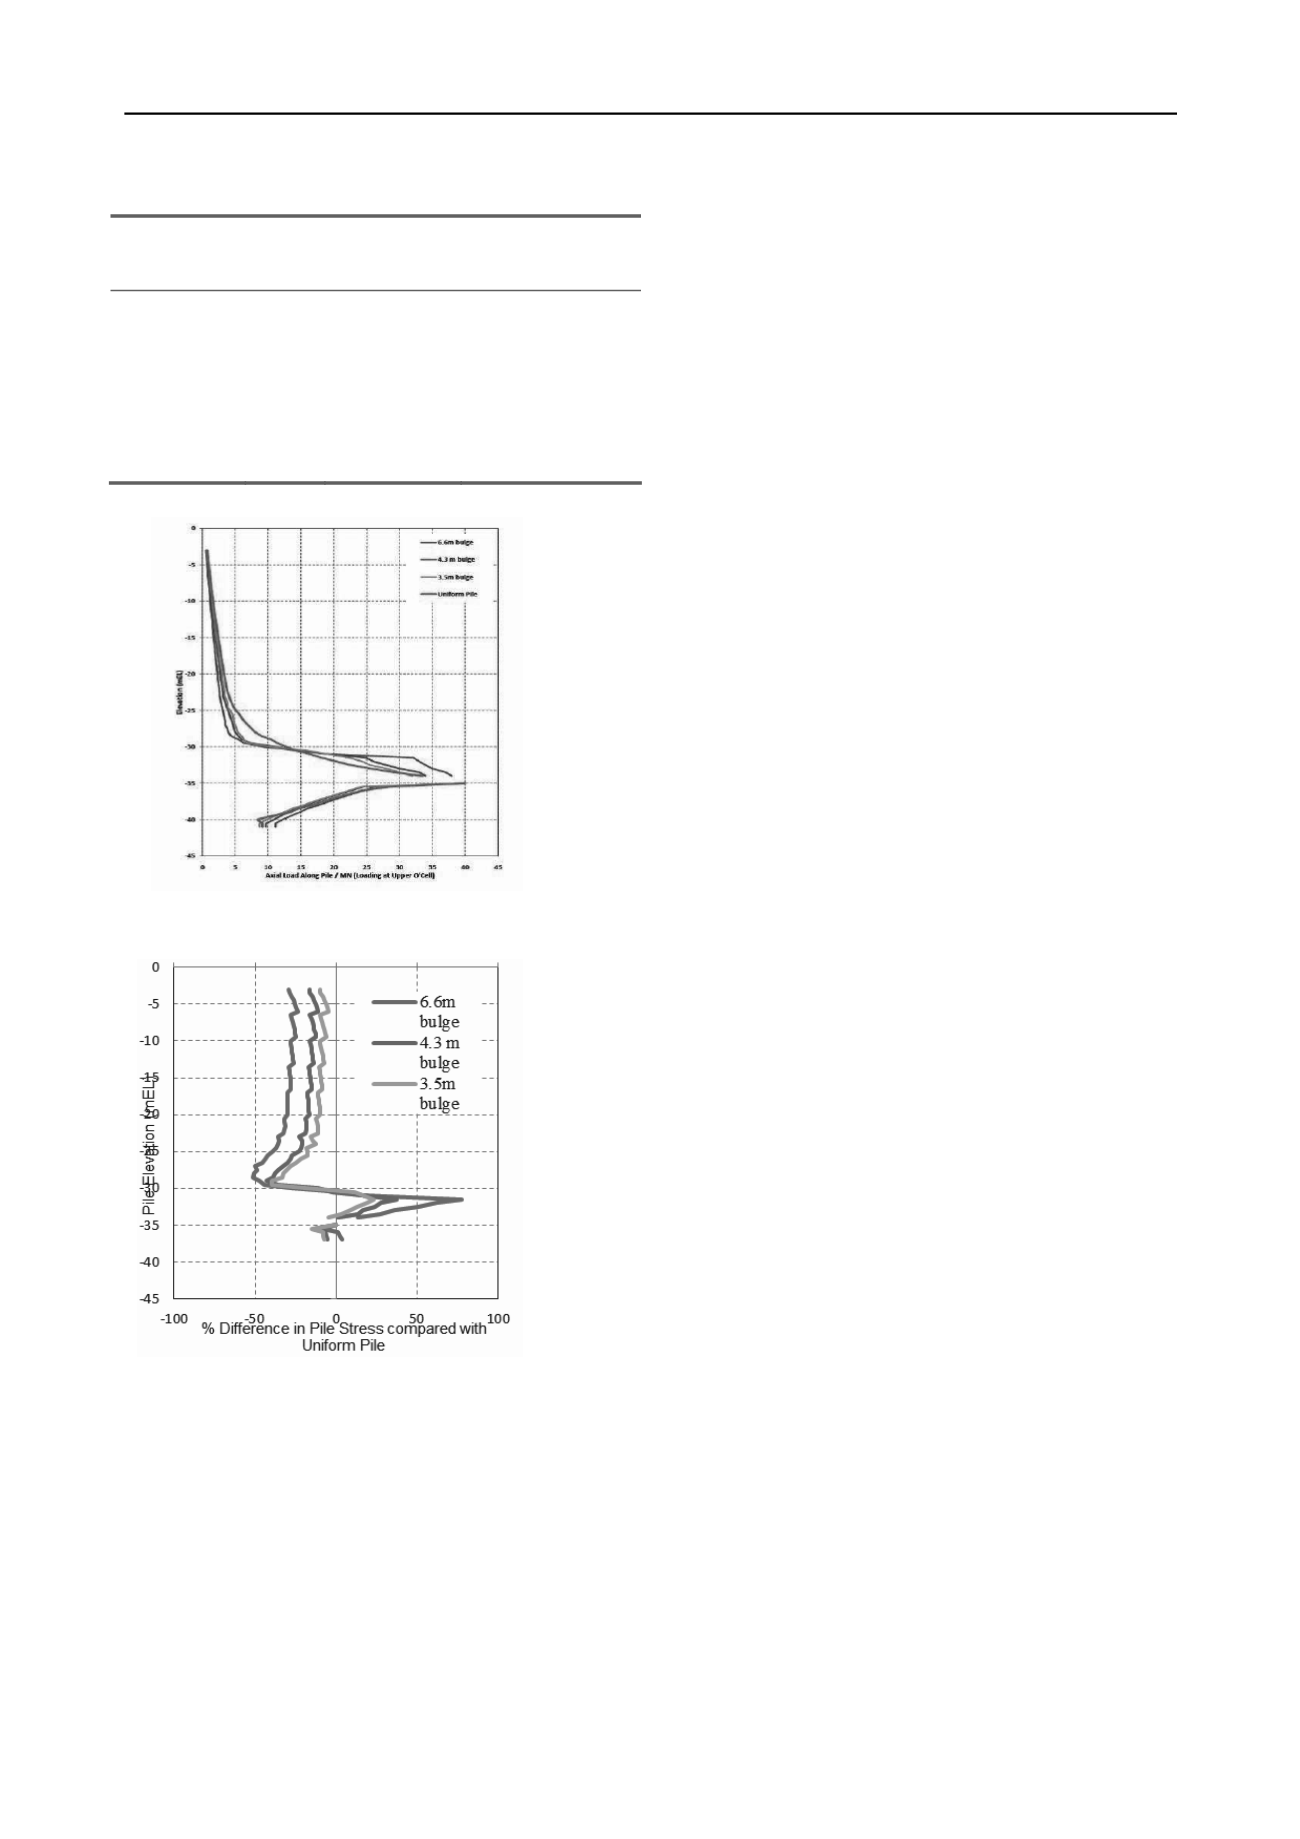
The results of the finite element modelling indicated that the
presence of irregularities in the pile cross section results in
unusually high stresses being generated within the pile section
immediately below the pile over-break zones. Proper
interpretation of load test data requires consideration of possible
non-uniformity of pile section and concrete quality.
Table 5. Summary of key geotechnical parameters
Layer
Thickness
(m)
Young’s
modulus MPa
Shear strength
Marine 1
3.5
4.6
18.5 kPa
Marine 2
2
30
35°
W. soil
3.5
60
200 kPa
W. rock
Soft rock
5
11.5
2000
3000
700 kPa
1000 kPa
Figure 4 Computed axial load distributions
REFERENCE
Abdelrazaq, A., Badelow, F., Sung-Ho Kim and Poulos, H.G. (2011).
Foundation design for the 151 storey Incheon tower in a
reclamation area.
Geotechnical Engineering, Jnl. SEAGS, AGSEA,
Vol. 42, No.2, 85-93.
Figure 5 Effect of pile non-uniformity on pile stress


