2822
Proceedings of the 18
th
International Conference on Soil Mechanics and Geotechnical Engineering, Paris 2013
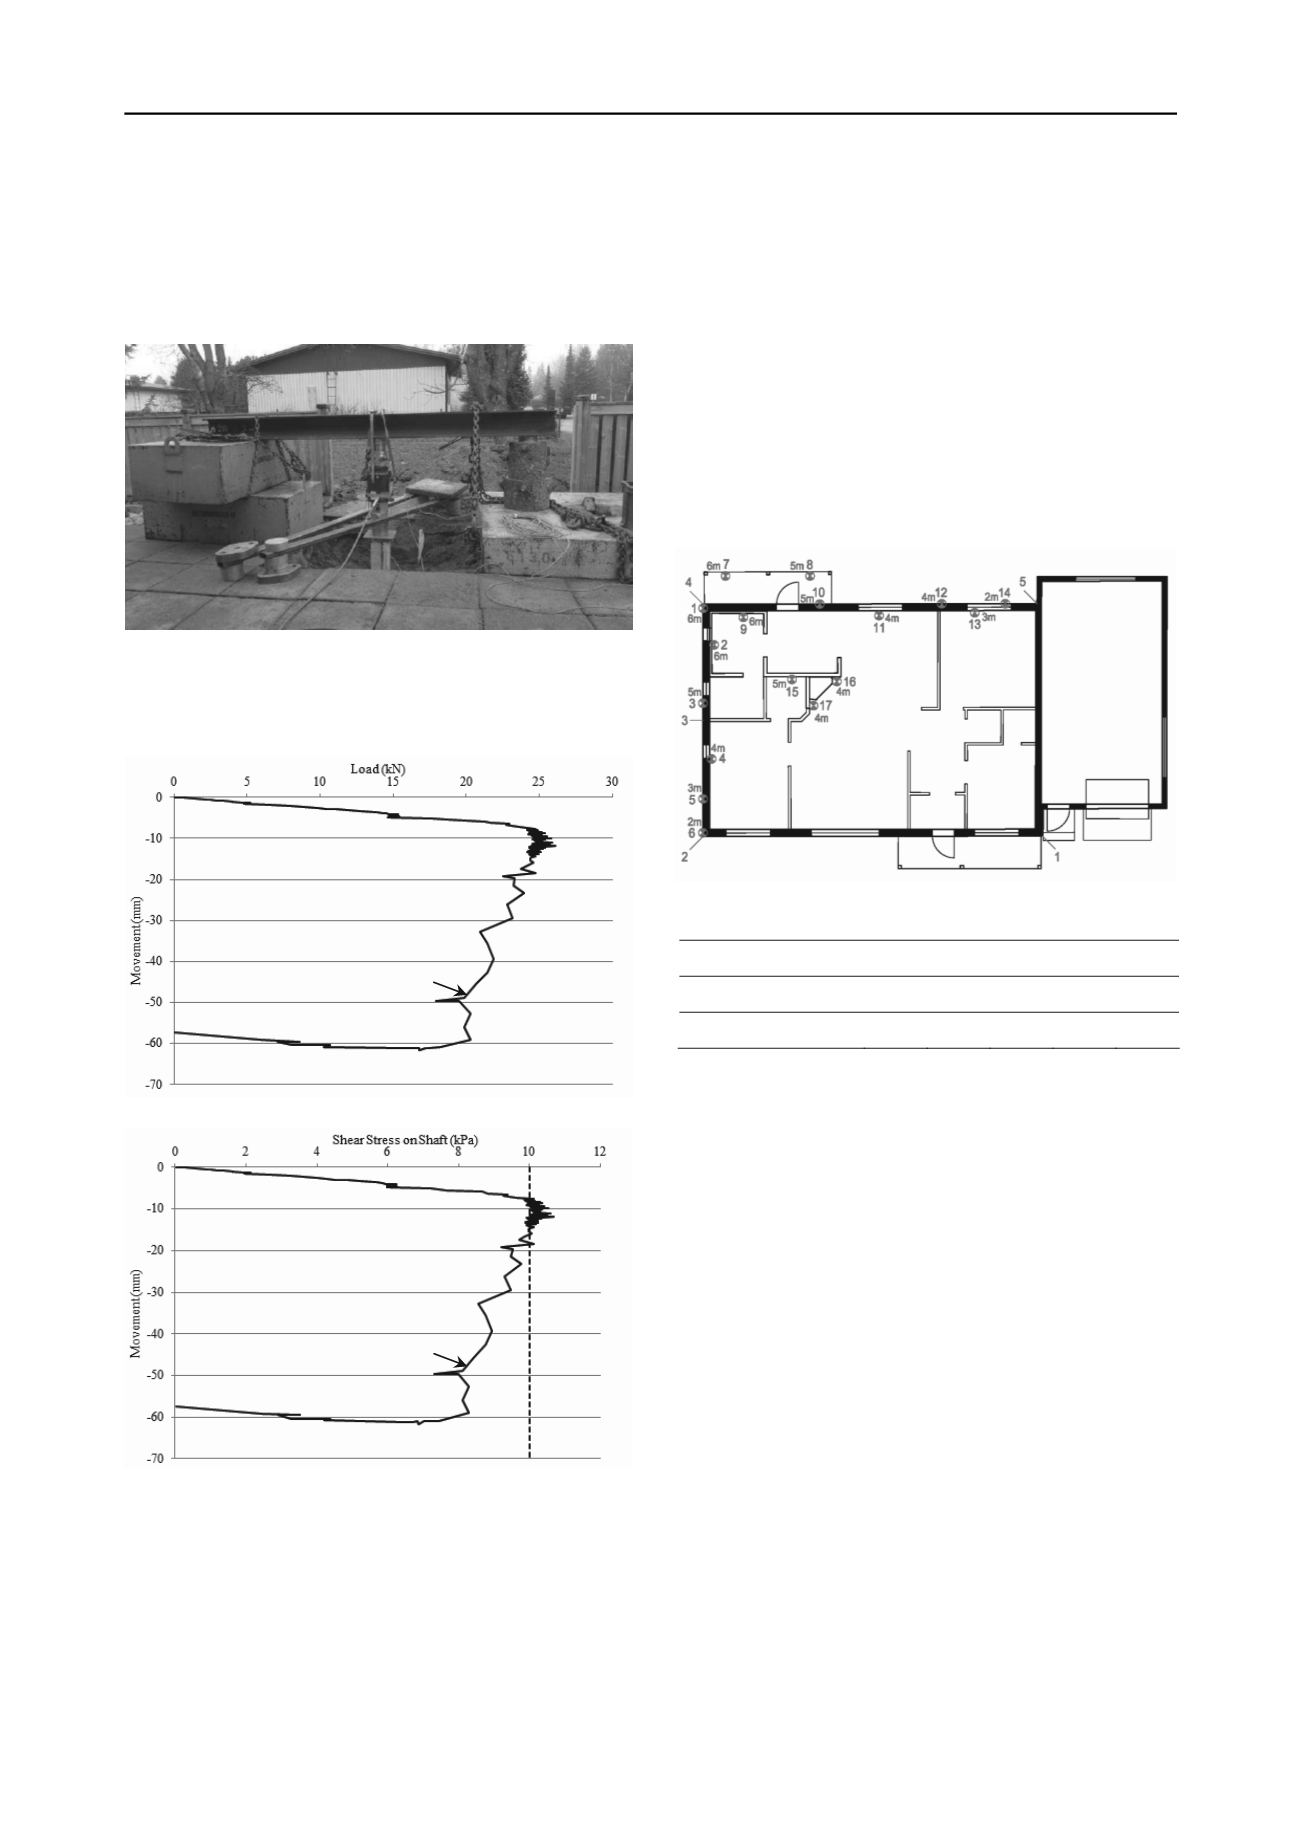
The arrangement of the load test is shown in picture 4. The
basic idea of the arrangement was similar to the load test in
Turku. The loading was again achieved with hydraulic jack
against steel beam and counterweights. Applied load was
measured with load sensor and the movement was measured as
relative to normal ground surface.
4 MONITORING OF SETTLEMENT
There have been monitoring of settlements in some test projects
in Finland. Unfortunately there is not any settlement history
before the installation of polymer pillars, because these houses
are privately owned. Also the monitoring period after the
projects is still quite short. The longest monitoring period is
only less than two years.
The relative settlement of the houses show the settlement
slows significantly with cohesion polymer pillars. In these test
projects the polymer pillars have usually been installed under
only part of the building.
Pillars and settlement monitoring points of one test project
are shown in picture 5. The relative settlement of the monitoring
points is presented in Table 5. The first monitoring was made
before the installation and the second after the installation.
Picture 4. Arrangement of the load test in Salo 2012.
The load-movement curve was drawn from the results as
shown in Figure 4. As a comparison to the test pillars in Turku,
the shear stress-movement curve was also drawn. The shear
stress-movement curve is shown on Figure 5.
S1
Picture 5. Pillars and settlement monitoring points of a test project.
Table 5. Relative settlement of the test project in millimeters.
1
2
3
4
5
25.05.2010
± 0
- 20
-
- 105
- 32
23.01.2012
± 0
- 6
- 46
- 98
- 28
5 CONCLUSION
Figure 4. Load-movement curve of the load test in Salo 2012.
The polymer pillar is a relatively new product. There have been
some load tests and material tests as presented in this paper.
Nevertheless there are still a lot of tests to be done to determine
the bearing capacity and the suitability of the polymer pillar in
different types of soil conditions. Beside these tests, there are
projects done all the time and there is a lot of data to be
collected from these projects.
S1
6 ACKNOWLEDGEMENTS
The load tests presented were sponsored by TEKES – the
Finnish Funding Agency for Technology and Innovation.
7 REFERENCES
Figure 5. Shear stress-movement curve of the load test in Salo 2012.
The measured C
u
value of the clay is shown with dashed line.
Lehtonen J. 2011. Underpinning project; owners’ views on technology,
economy and project management. Helsinki.
The load steps in Salo were estimated a bit too high.
Therefore there were only 3 steps before the failure of the pillar.
Sauerwald M. 1994. Hygiene-Institut of the Ruhr Area. Evaluation of
effect on water quality. Gelsenkirchen.
The ratio between shear stress and undrained shear stress of
the clay was not as big in Salo as it was in Turku. Reason for
this is probably the size of the load steps.
Kwarteng W. and Füchtjohann L. 2011. HuK Umweltlabor GmbH.
Umweltunbedenklichkeitsuntersuchungen. Wenden-Hünsborn.
van der Wal A. 2010. Chemical resistance of Uretek Resins. Foxhol.


