2817
Technical Committee 212 /
Comité technique 212
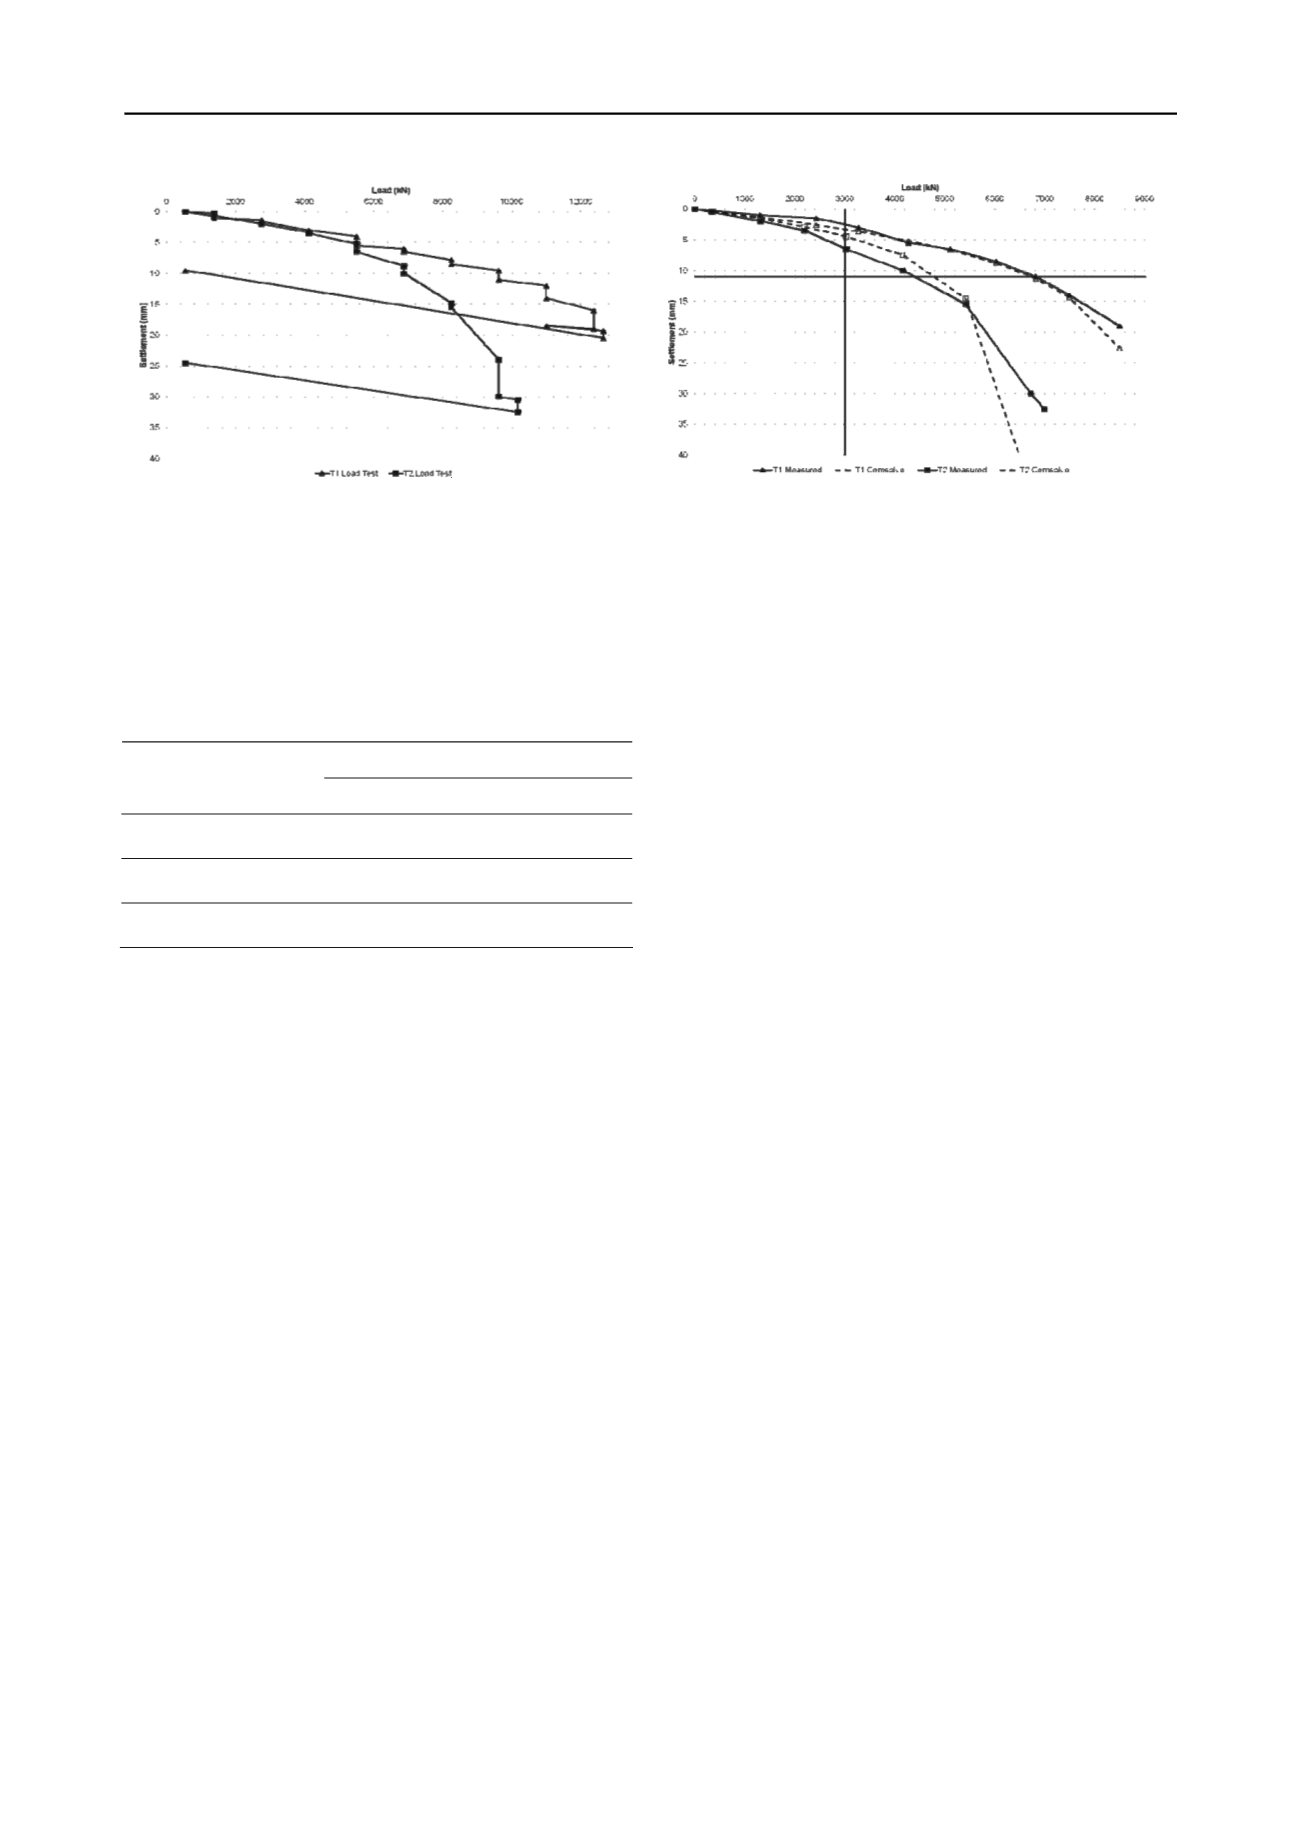
Figure 3. Load-displacement behaviour of piles: measured during
testing.
Strain gauges installed along the length of the piles were
used by Bauer to calculate the skin friction mobilised within
each stratum; this information is summarised in Table 2
alongside the ultimate values originally calculated for tender
design using the site investigation data (see Table 1).
Table 2. Calculated and measured skin friction.
Ultimate Skin Friction (kN/m
2
)
Strata
Calculated
T1
T2
Fine Sand
59
110
50
Loam A: Silty Sand
80
110
45
Loam B: Clayey Silt
50
110
90
4.3
Interpretation of Pile Testing
Several simple calculations were made of the ultimate shaft
capacity using the values of skin friction from the strain gauge
data. From these it was apparent that skin friction had not been
completely excluded over the top 10m of each pile. The first
stage of the interpretation was therefore to remove the
contribution of the top 10m from the results so that they were
comparable to the design values. The load cell installed by
Bauer in the toe of the pile confirmed that very little base
resistance was generated (1.2MN assumed in Cemsolve
analysis).
Figure 4 presents the load-displacement behaviour of the two
piles. The values of load applied have been modified at each
stage to remove the contribution of the top 10m of pile. The
measured curve for T1 on Figure 4 has been stopped at the load
stage just prior to the load being reduced and then replaced
(refer also to Figure 3).
The Fugro Loadtest Ltd program Cemsolve was used to
compare the modified test data to Fleming’s load-displacement
relationship, which is commonly used to predict pile behaviour
under loading (Fleming, 1992). Figure 4 also shows the
Cemsolve model of the pile behaviour (back analysed using the
modified data from the load tests). The Cemsolve curve fit
suggests that the ultimate capacity of T1 was 10.0MN (of which
9.5MN was shaft capacity) and of T2 was 7.25MN (of which
6.5MN was shaft capacity); these values were assumed as an
estimate of the failure load i.e. Cemsolve prediction of when
settlement continues to increase with no further load applied.
These values are higher than the loads at which the two pile
tests were terminated, which is considered to be due to practical
difficulties in measuring the response to loading when close to
failure.
Figure 4. Load-displacement behaviour of piles: measured and
Cemsolve predictions (with contribution from top 10m of piles shaft
removed).
5 DISCUSSION
5.1
Comparison of Testing Results with Design Values
The ultimate shaft friction for the untreated pile T2 obtained
from curve fitting (6.5MN) is considered to be in reasonable
agreement with the calculated tender design value 5.47MN.
When considering this in greater detail by comparing the
measured and calculated skin friction values (Table 2) it can be
observed that the Loam A did not provide as much skin friction
as considered within the design and the Loam B provided more.
From this it is proposed that the silt content of the Loam A
reduced its frictional behaviour more than the original design
considered. It is also apparent that the estimate for the
behaviour of the Loam B was too conservative. It is possible
that the high silt and water content of the material resulted in
misleading in-situ testing results.
It is considered that the base resistance was not fully
mobilised for either pile as the test was stopped before the piles
could move a sufficient amount.
5.2
Improvement due to Shaft Grouting
The shaft grouted pile T1 is considered to have performed
considerably better than the untreated pile. Figure 4 shows that
at a working load of 3.0MN, the shaft grouted pile settled
approximately 50% less than the untreated pile. A line has been
plotted on Figure 4 at a settlement of 1% of pile diameter
(11mm) to further illustrate the difference in pile performance.
The untreated pile settled by 11mm at a load of 4.4MN and the
shaft grouted pile settled by 11mm at a load of 6.8MN.
As previously stated it is considered that the ultimate shaft
capacity (calculated from curve fitting) was increased by
approximately 46% from 6.5MN to 9.5MN.
By looking at the strain gauge data in Table 2 it is possible to
infer the relative improvement the shaft grouting made to each
stratum. The data suggests that the skin friction of the Fine
Sand, Loam A and Loam B were respectively improved by
120%, 144% and 22% (i.e. by a factor of 2.2, 2.4 and 1.2).
The Fine Sand and the Loam A were of a relatively similar
grading and so it is perhaps unsurprising that a similar
improvement was achieved in these two strata. Improvement in
the Loam A was not expected due to its higher silt content;
however, the silt content did not impede the improvement and it
is therefore inferred that an enhancement in skin friction is
possible within a material assuming it has a minimum content
of granular material.
The improvement within the Loam B, although
comparatively small, confirms the suggestion that it had


