2825
Technical Committee 212 /
Comité technique 212
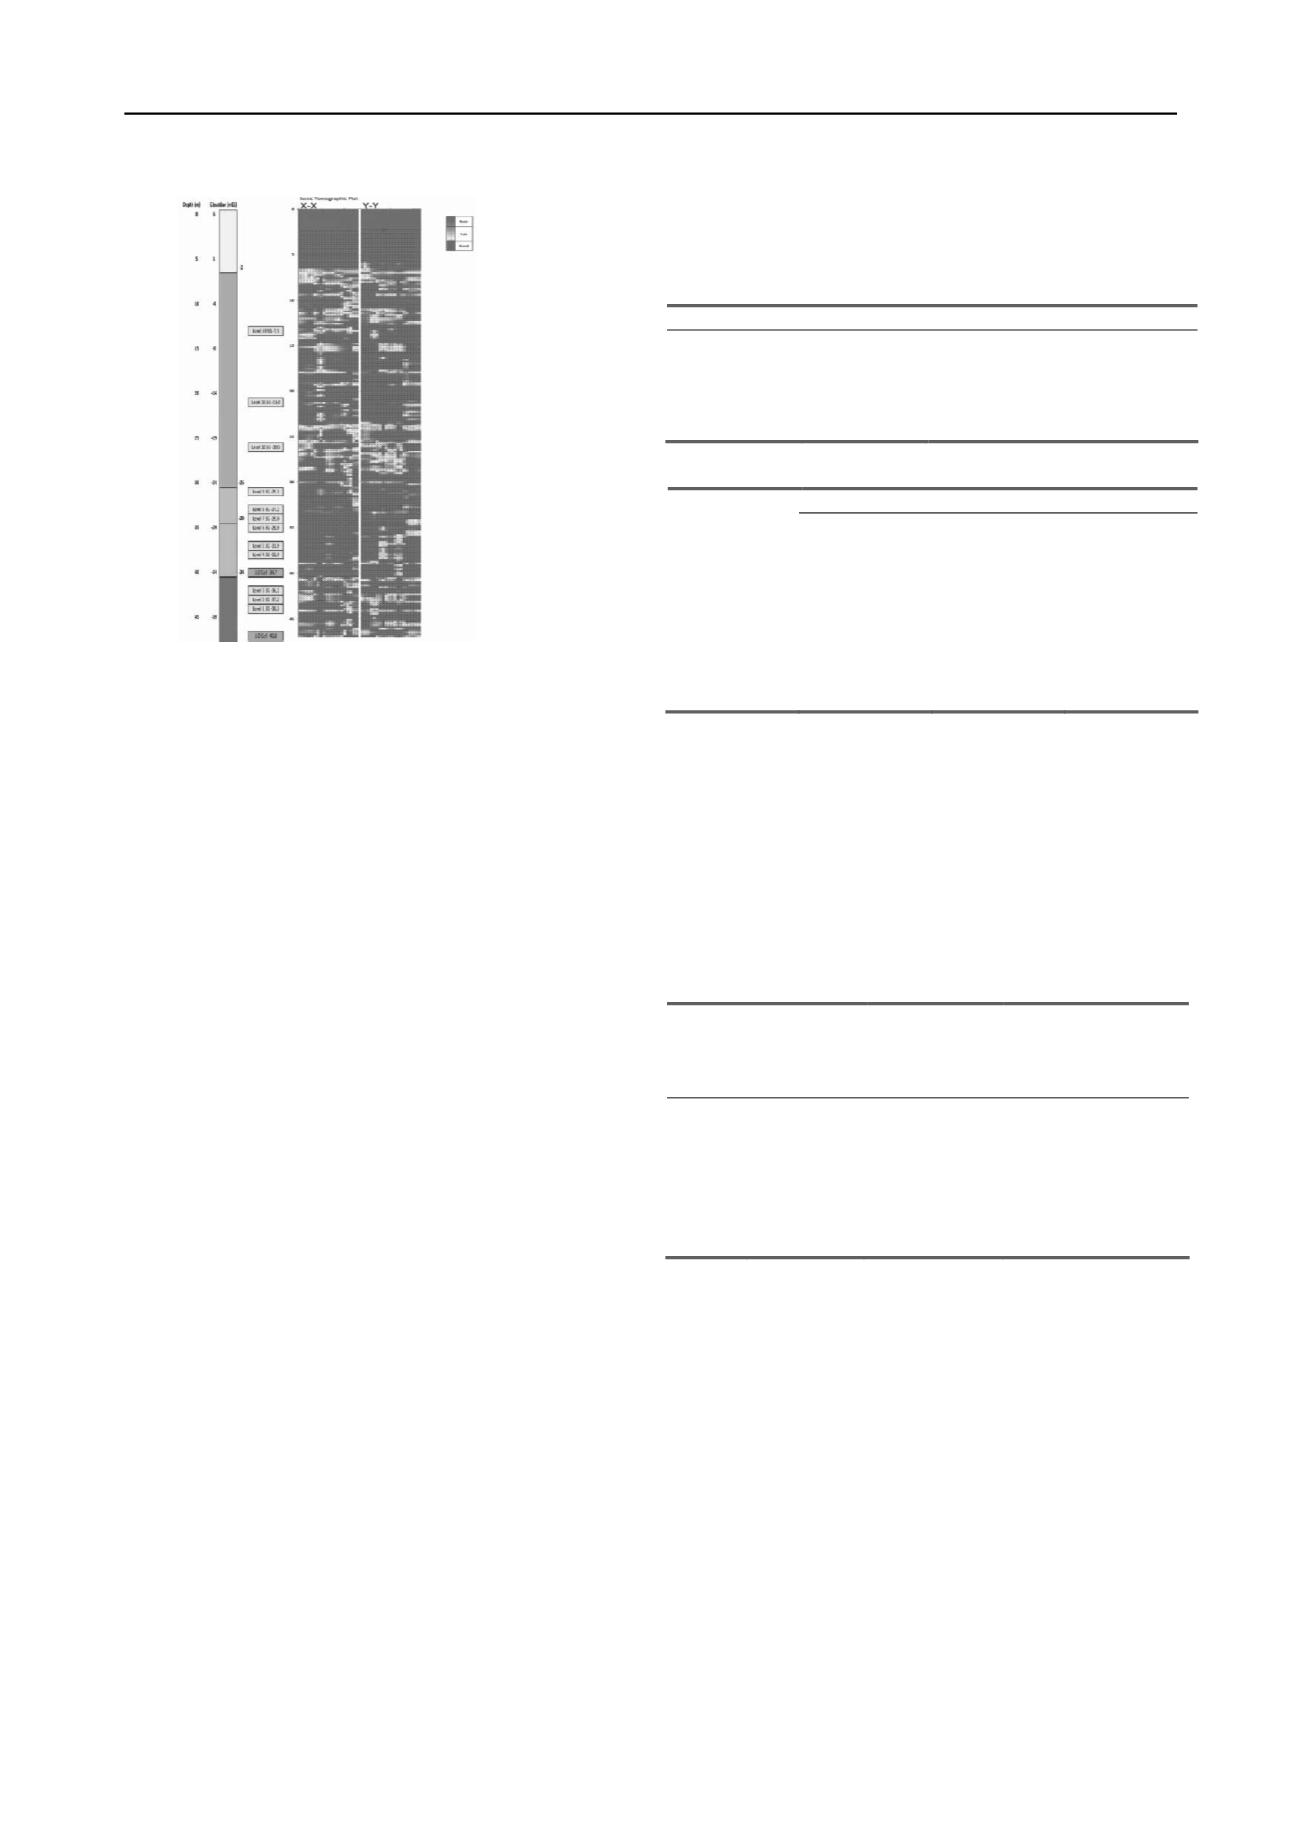
Figure 3 Tomographic image of pile
3. ANTICIPATED EFFECTS OF NON HOMOGENEITY
The effect that variation in the pile profile (i.e. over-break
and necking) and concrete quality could have on strain
measurements obtained during the pile load testing was
estimated based on the measurements during construction
described above. The effect of the pile shape and concrete
quality was assessed using the finite element analysis program
PLAXIS.
3.1 Pile Shape Effect on Strain Measurements
The strain measurements recorded during the pile load test
were resolved to assess stress at levels within the pile based on
the cross sectional area of the pile and the concrete modulus. A
uniform cylindrical pile shape was assumed but it was
recognised that, where large over-breaks occurred, the stress
within the pile at these locations could be underestimated, as the
pile stiffness is proportional to the square of the pile radius.
The measurements taken during the pile concreting were
limited to measurements every 5 m or 6 m and therefore did not
enable the pile profile to be accurately assessed. Table 3 gives
an indication of the effect of pile over-break on pile stiffness,
for various length intervals, based on some of the diameters that
may be possible on the basis of the concreting records. If the
pile diameter is not considered when the pile load results are
analysed, capacities will be underestimated at over-break levels
and overestimated where necking occurs. This phenomenon
may then appear as an apparent stress reversal within the pile.
3.2 Concrete Quality Effect on Strain Measurements
In interpreting pile load test data, the pile concrete quality is
generally assumed to be homogeneous throughout the pile and
results are resolved from a single modulus value for the pile.
The sonic logging results for TP-03 derived from the sonic
tomography showed that marked variation in the pile concrete
quality occurs at specific locations across the full cross section
of the pile, and also occurs non-uniformly along the pile.
Variable strains are therefore likely to develop within the pile
during testing, with measured differences in excess of 50%
anticipated. The sonic logging tomography assessment
facilitates reconciliation of the measured results with the
concrete quality and allows attribution of apparent “bending” to
concrete quality variation, rather than to changes in pile
verticality or shape. In general, the stress at a particular level is
assessed based on an average of 2 or 4 strain gauge
measurements and results will need to be reviewed individually
to avoid the pile stress being miscalculated.
Table 2. Summary of Assessed Concrete Quality
Depth Range m
Assessed % good quality concrete
4.5
7.5
10
11.5
13.5
70
23.5
27.0
0 to 30
27.0
29.0
30 to 70
41.0
47.0
60
Table 3. Pile stiffness variation due to pile overbreak
% change in pile stiffness due to overbreak
Interval length of pile section considered m
Depth range m
1
2
3
9-14
300
150
122
14-19
400
275
133
19-24
300
150
122
24-29
300
150
122
29-35
750
263
172
35-41
200
125
111
41-47
150
113
105
3.3 Finite Element Analysis: Pile Shape and Load Distribution
Finite element analyses were carried out for TP-03, using the
computer program PLAXIS, to assess the impact of over-break
on the load distribution along the length of the pile.
An axi-symmetric model using 15-node elements was
developed to model a uniform cylindrical pile, as well as
models representing piles with varying overbreak diameters
over varying sections of the pile. A summary of the cases
analysed is presented in Table 4. Ground elevation was at
+6.0mEL.
Table 4. Summary of Finite Element Analysis Cases
Case
Pile
Diameter
(m)
Overbreak
Diameter
(m)
Elevation of
Overbreak Section
(m EL)
1
2.4
N/A
N/A
2
2.4
6.6
-30.2 to -31.2
3
2.4
4.3
-28.2 to -31.2
4
2.4
3.5
-25.2 to -31.2
The geotechnical parameters used in the analysis are
summarised in Table 5. The pile load test was simulated by the
application of a traction load of 7500kPa at depths of EL-34.4 m
and EL-34.8 m, which are similar to the elevation of the upper
O-cell and below the modelled pile over-break zones. The pile
was modelled using linear elastic elements with appropriate
concrete stiffness parameters ascribed. A plate element with
negligible axial stiffness was also modelled within the concrete
to allow assessment of the normal force developed within the
pile due to the applied loading.
The results of the PLAXIS analysis are summarised in
Figures 4 and 5. Figure 4 shows the assessed load distribution
along the pile length resulting from the applied load. Figure 5
shows the calculated difference in pile stress at locations along
the pile as compared to the expected distribution for a pile of
uniform cross-section. It can be seen from Figure 5 that the
presence of irregularities in the pile cross section results in
unusually high stresses being calculated within the pile section
immediately below the pile over-break zones.


