 
          2829
        
        
          Technical Committee 212 /


            Comité technique 212


            Proceedings of the 18


            th


            International Conference on Soil Mechanics and Geotechnical Engineering, Paris 2013


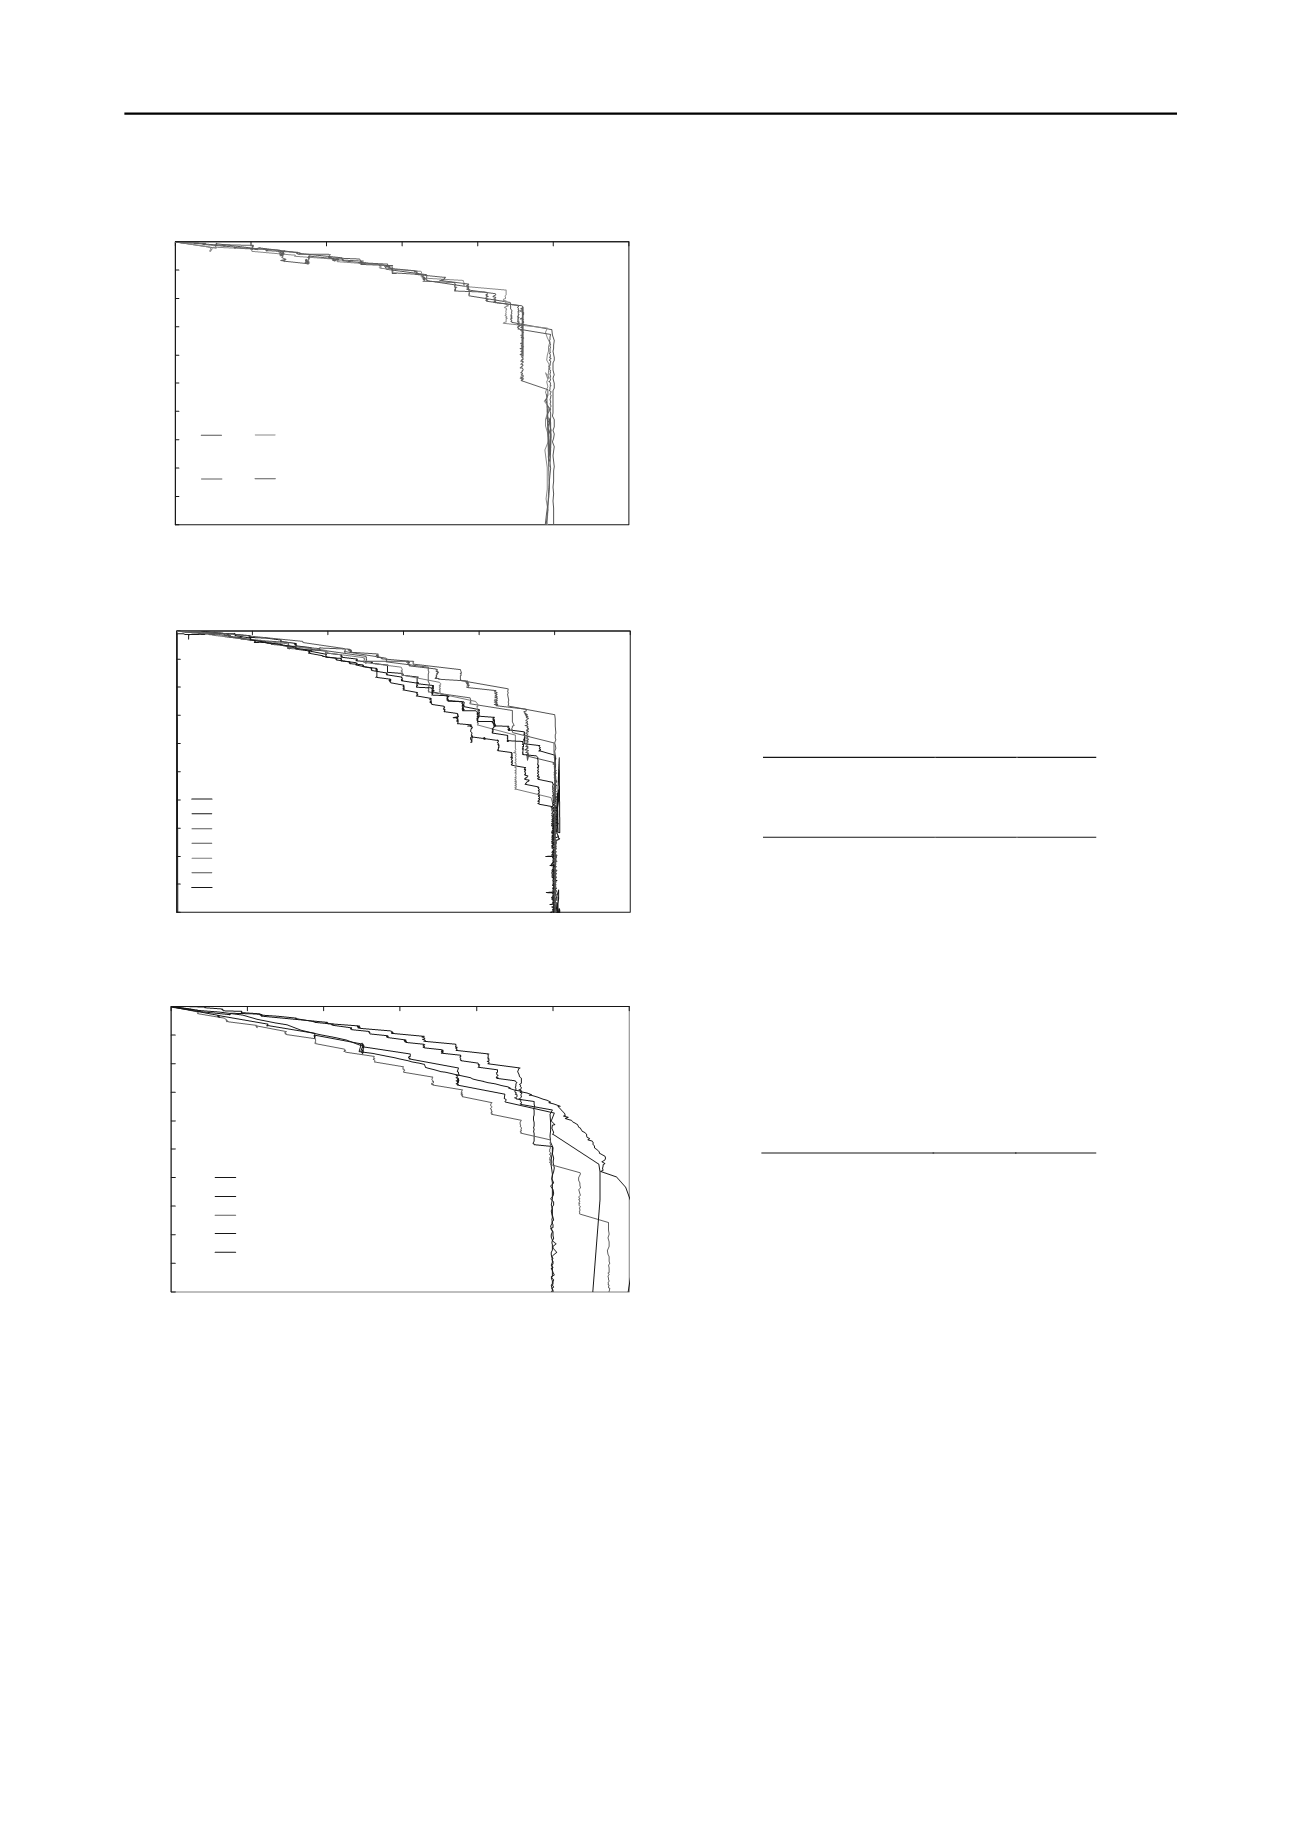
          Figure 2. Normalised bored pile test results.
        
        
          Figure 3. Normalised CFA pile test results.
        
        
          Figure 4. Normalised displacement pile test results.
        
        
          4.1.2


            Results


          –


            bored piles


          The results from the 4 bored piles gave remarkably consistent
        
        
          values for
        
        
          α
        
        
          in the range 0.5 to 0.55. They all gave a very
        
        
          similar behaviour, failing at a pile head movement of about
        
        
          3mm as shown in normalized plot in Figure 2.
        
        
          4.1.3


            Results


          –


            CFA piles


          The 7 CFA piles showed a significant variation in capacity with
        
        
          control of installation. The ‘normal’ drilling installation
        
        
          parameters for a clay of this type is around 100mm penetration
        
        
          per revolution. A lower penetration per revolution increases the
        
        
          potential for greater smearing of the bore, whilst the converse is
        
        
          true where higher penetration rates are used.
        
        
          In the study, rates of 150mm or 120mm, 100mm and 50mm
        
        
          penetration/revolution were used for the different 300mm and
        
        
          400mm diameter augers with a common pitch of 350mm
        
        
          (Skinner et al 2003). These rates were label
        
        
          led ‘tight’, ‘normal’
        
        
          and ‘loose’. The capacities found
        
        
          showed that there was an
        
        
          increase in
        
        
          α
        
        
          for a higher penetration per revolution (Table 3).
        
        
          The value found could be related to installation (Figure 5). The
        
        
          worst value obtained (TP13) gave an
        
        
          α
        
        
          value close to that of the
        
        
          ‘bored’ piles! The change of α
        
        
          for CFA piles has potential
        
        
          benefits for challenging sites, but carries a warning that
        
        
          preliminary test piles need to be installed with the same
        
        
          parameters same as working piles, to ensure the design
        
        
          parameters selected are appropriate. The 3
        
        
          ‘normal’ CFA piles
        
        
          gave
        
        
          α
        
        
          values in the range 0.72-0.75 which are somewhat higher
        
        
          than the typically used value of 0.6. This may reflect the fact
        
        
          that low values have been encountered previously and this may
        
        
          have been a result simply of poor construction control.
        
        
          They all showed basically similar behaviour, failing at a pile
        
        
          head movement of between 3 and 5mm, those going to 5mm
        
        
          showing a slightly more curved response as shown in Figure 3
        
        
          normalized plots. For the 300mm diameter CFA piles, the
        
        
          longer piles show the more curved behaviour but these were
        
        
          also loaded in smaller increments and as a result took longer
        
        
          times to failure - which may have allowed more shedding of
        
        
          load down the pile as local failure occurred at shallow depths.
        
        
          The 450mm diameter piles (MC1 and MC2) showed the stiffest
        
        
          behaviour but were loaded in larger increments and so shorter
        
        
          times.
        
        
          Table 3. Derived Alpha values
        
        
          Pile  type
        
        
          Static
        
        
          failure
        
        
          load
        
        
          (kN)
        
        
          Alpha
        
        
          CFA (T33)
        
        
          700
        
        
          .84
        
        
          CFA (T34)
        
        
          600
        
        
          .72
        
        
          CFA (T14)
        
        
          625
        
        
          .75
        
        
          CFA (T13)
        
        
          325
        
        
          .52
        
        
          CFA (T15)
        
        
          500
        
        
          .82
        
        
          CFA (MC1)
        
        
          1000
        
        
          .72
        
        
          CFA (MC2)
        
        
          1050
        
        
          .75
        
        
          Bored (T16)
        
        
          450
        
        
          .54
        
        
          Bored (T40)
        
        
          225
        
        
          .51
        
        
          Bored (T46)
        
        
          300
        
        
          .52
        
        
          Bored (T47)
        
        
          310
        
        
          .54
        
        
          Screw Dispt (T30)
        
        
          650*
        
        
          .72
        
        
          Displacement (T35)
        
        
          525
        
        
          .73
        
        
          Displacement (T36)
        
        
          300
        
        
          .65
        
        
          Driven (TP1)
        
        
          1000
        
        
          1.0
        
        
          Driven (TP2)
        
        
          950
        
        
          .95
        
        
          *interpreted shaft only
        
        
          4.1.4


            Results


          –


            displacement piles- auger


          Auger displacement piles have the advantage of minimal spoil
        
        
          generation without the noise disadvantage of driven piles.
        
        
          Within the auger displacement pile category two pile types
        
        
          were tested, straight forward parallel sided piles with all soil
        
        
          displaced laterally and ‘screw’ displacement piles where a
        
        
          screw thread is cut out from the central shaft thereby giving a
        
        
          larger overall diameter to the pile, still with no soil removal and
        
        
          using less concrete than a CFA or bored pile of the same
        
        
          diameter. The normalised results are shown in Figure 4.
        
        
          The displacement piles (T35 and T36) gave
        
        
          α
        
        
          values of 0.65-
        
        
          0.72 while the screw displacement pile gave an
        
        
          α
        
        
          of 0.72 (based
        
        
          on the external diameter of the screw thread). The screw pile
        
        
          had a slightly softer response to loading but with the much
        
        
          larger potential base area and the different potential shaft failure
        
        
          modes this is not surprising. In the literature the diameter used
        
        
          to back calculate skin friction values is sometimes taken as a
        
        
          mean value between the central core and maximum thread
        
        
          diameter and care should be taken when comparing values as to
        
        
          the diameter used. The screw pile type tested (Atlas) showed
        
        
          capacity equivalent to a 600mm diameter CFA pile, with
        
        
          significantly lower concrete consumption.
        
        
          0
        
        
          1
        
        
          2
        
        
          3
        
        
          4
        
        
          5
        
        
          6
        
        
          7
        
        
          8
        
        
          9
        
        
          10
        
        
          0
        
        
          0.2
        
        
          0.4
        
        
          0.6
        
        
          0.8
        
        
          1
        
        
          1.2
        
        
          Displacement (mm)
        
        
          Load / assessed shaft capacity
        
        
          T16 T40
        
        
          T47 T46
        
        
          0
        
        
          1
        
        
          2
        
        
          3
        
        
          4
        
        
          5
        
        
          6
        
        
          7
        
        
          8
        
        
          9
        
        
          10
        
        
          0
        
        
          0.2
        
        
          0.4
        
        
          0.6
        
        
          0.8
        
        
          1
        
        
          1.2
        
        
          Displacement (mm)
        
        
          Load / assessed shaft capacity
        
        
          T34
        
        
          T33
        
        
          MC2
        
        
          MC1
        
        
          T15
        
        
          T13
        
        
          T14
        
        
          0
        
        
          1
        
        
          2
        
        
          3
        
        
          4
        
        
          5
        
        
          6
        
        
          7
        
        
          8
        
        
          9
        
        
          10
        
        
          0
        
        
          0.2
        
        
          0.4
        
        
          0.6
        
        
          0.8
        
        
          1
        
        
          1.2
        
        
          Displacement (mm)
        
        
          Load / assessed shaft capacity
        
        
          T35
        
        
          T36
        
        
          T30
        
        
          TP1
        
        
          TP2