2821
Technical Committee 212 /
Comité technique 212
Table 2. Elastic modulus at compressive stress range from 1.0 N/mm
2
to
2.0 N/mm
2
.
2
4
5
E (N/mm
2
)
254
304
274
3 GEOTECHNICAL CAPACITY
So far there have only been two load tests for the cohesive
polymer pillar. Both of the load tests have taken place in
Southwest of Finland. The first load test was in June 2010 in
city of Turku. The second load test was in November 2012 in
city of Salo.
Both of the load tests were made in co-operation with
Tampere University of Technology. The pillars were tested until
they could not hold the load any more.
The test pillars are named with a letter T or S depending on
the city and a number.
3.1
Load test in Turku, 2010
The load test was accomplished at the front yard of a test
project. The polymer pillars for the load test were installed into
a soft clay layer. Undrained shear strength of the clay was
measured with vane test and the result was 15 kPa.
Total of five polymer pillars were tested. The top of each
pillar was excavated to sight and they were cut to achieve
smooth surface for loading. Therefore the lengths of pillars are
not equal. The lengths of pillars and amounts of injected
geopolymer are shown in Table 3.
Table 3. Tested polymer pillars in Turku 2010.
T2
T3
T4
T6
T7
Original length (m)
4.0
4.0
4.0
4.0
8.0
Tested length (m)
3.65
3.53
3.54
3.00
6.21
Total injection (kg) 210.5 165.8 196.0 142.5 300.8
Injection (kg/m)
52.6
41.4
49.0
35.6
37.6
The arrangement of the load test is shown in Picture 3. The
loading was achieved with hydraulic jack against steel beam
and counterweights. Applied load was measured with load
sensor and the movement was measured as relative to normal
ground surface.
Picture 3. Arrangement of the load test in Turku 2010.
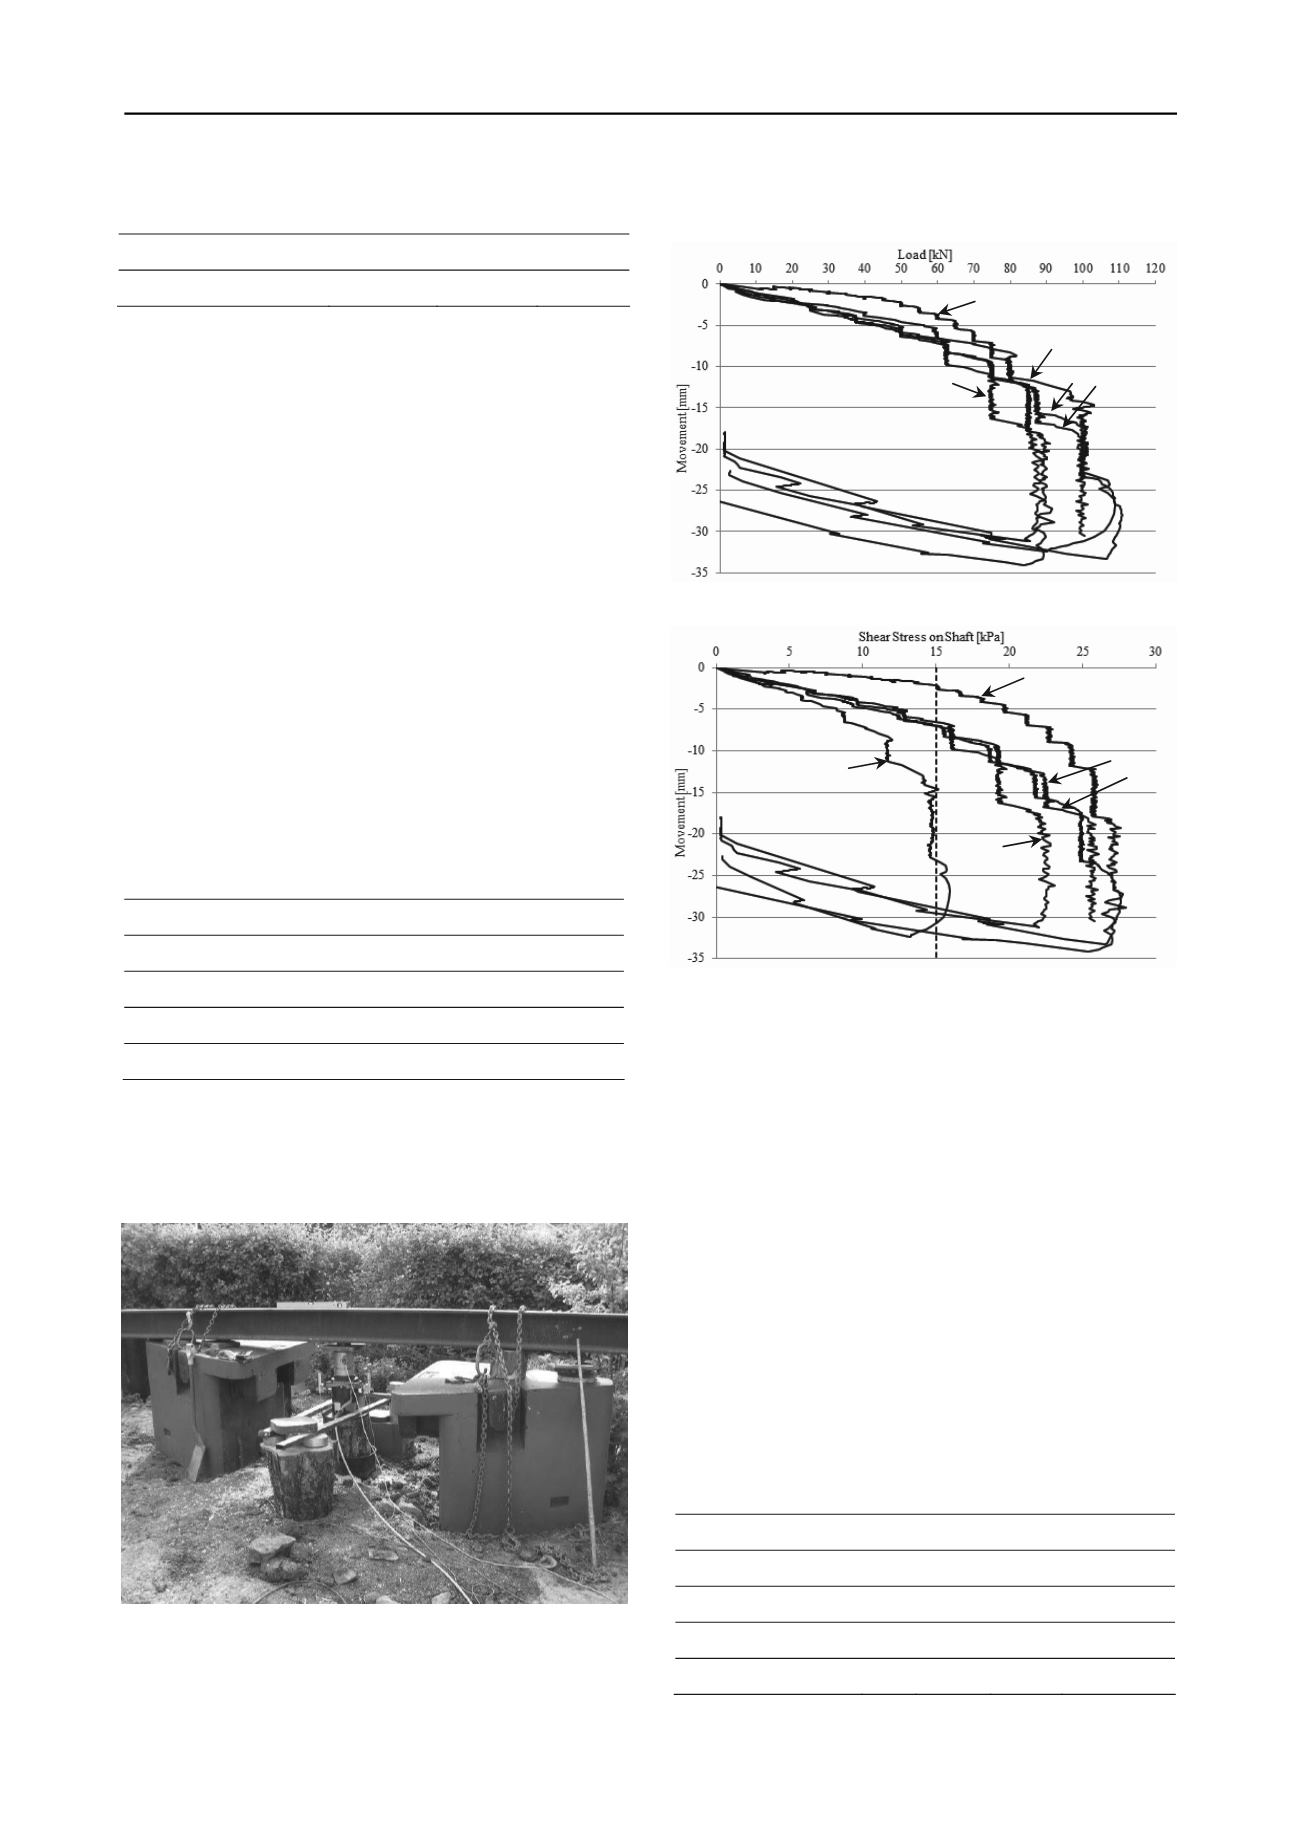
The load-movement curve was drawn from the results as
shown in Figure 2. Because of different lengths of pillars, the
load-movement curve does not give the information needed.
Therefore was needed to calculate the shear stress between shaft
of pillar and clay. The shear stress-movement curve is shown on
Figure 3.
T6
T7
T2
T3
T4
Figure 2. Load-movement curves of the load test in Turku 2010.
T6
T4
T7
T2
T3
Figure 3. Shear stress-movement curve of the load test in Turku 2010.
The measured C
u
value of the clay is shown with dashed line.
The installation on test pillar T7 was not succeeded. There
had been some problems with the injection pump during the
injection. Nevertheless it was decided to be tested. The result is
significantly worse than the result of the shorter pillars.
With other pillars the test succeeded. The test shows the
cohesive grip between pillar and clay is good. The shear stress
between the shaft of the pillar and the clay is bigger than the
undrained shear strength of the clay. Partly this can be
explained with the speed of the load test. Each load step was 30
minutes and the entire loading took about 4 hours per pillar.
3.2
Load test in Salo, 2012
This load test was also accomplished at the front yard of a test
project. The polymer pillar for the load test was installed into a
soft clay layer. Undrained shear strength of the clay was
measured with vane test and the result was 10 kPa.
Only one pillar was tested at this site. The preparing
procedure for pillar was similar to the test pillars in Turku. The
length of pillar and the amount of injected geopolymer is shown
in Table 4.
Table 4. Tested polymer pillar in Salo 2012.
S1
Original length (m)
3.0
Tested length (m)
2.36
Total injection (kg)
90.0
Injection (kg/m)
30.0


