2813
Technical Committee 212 /
Comité technique 212
Trace
axis
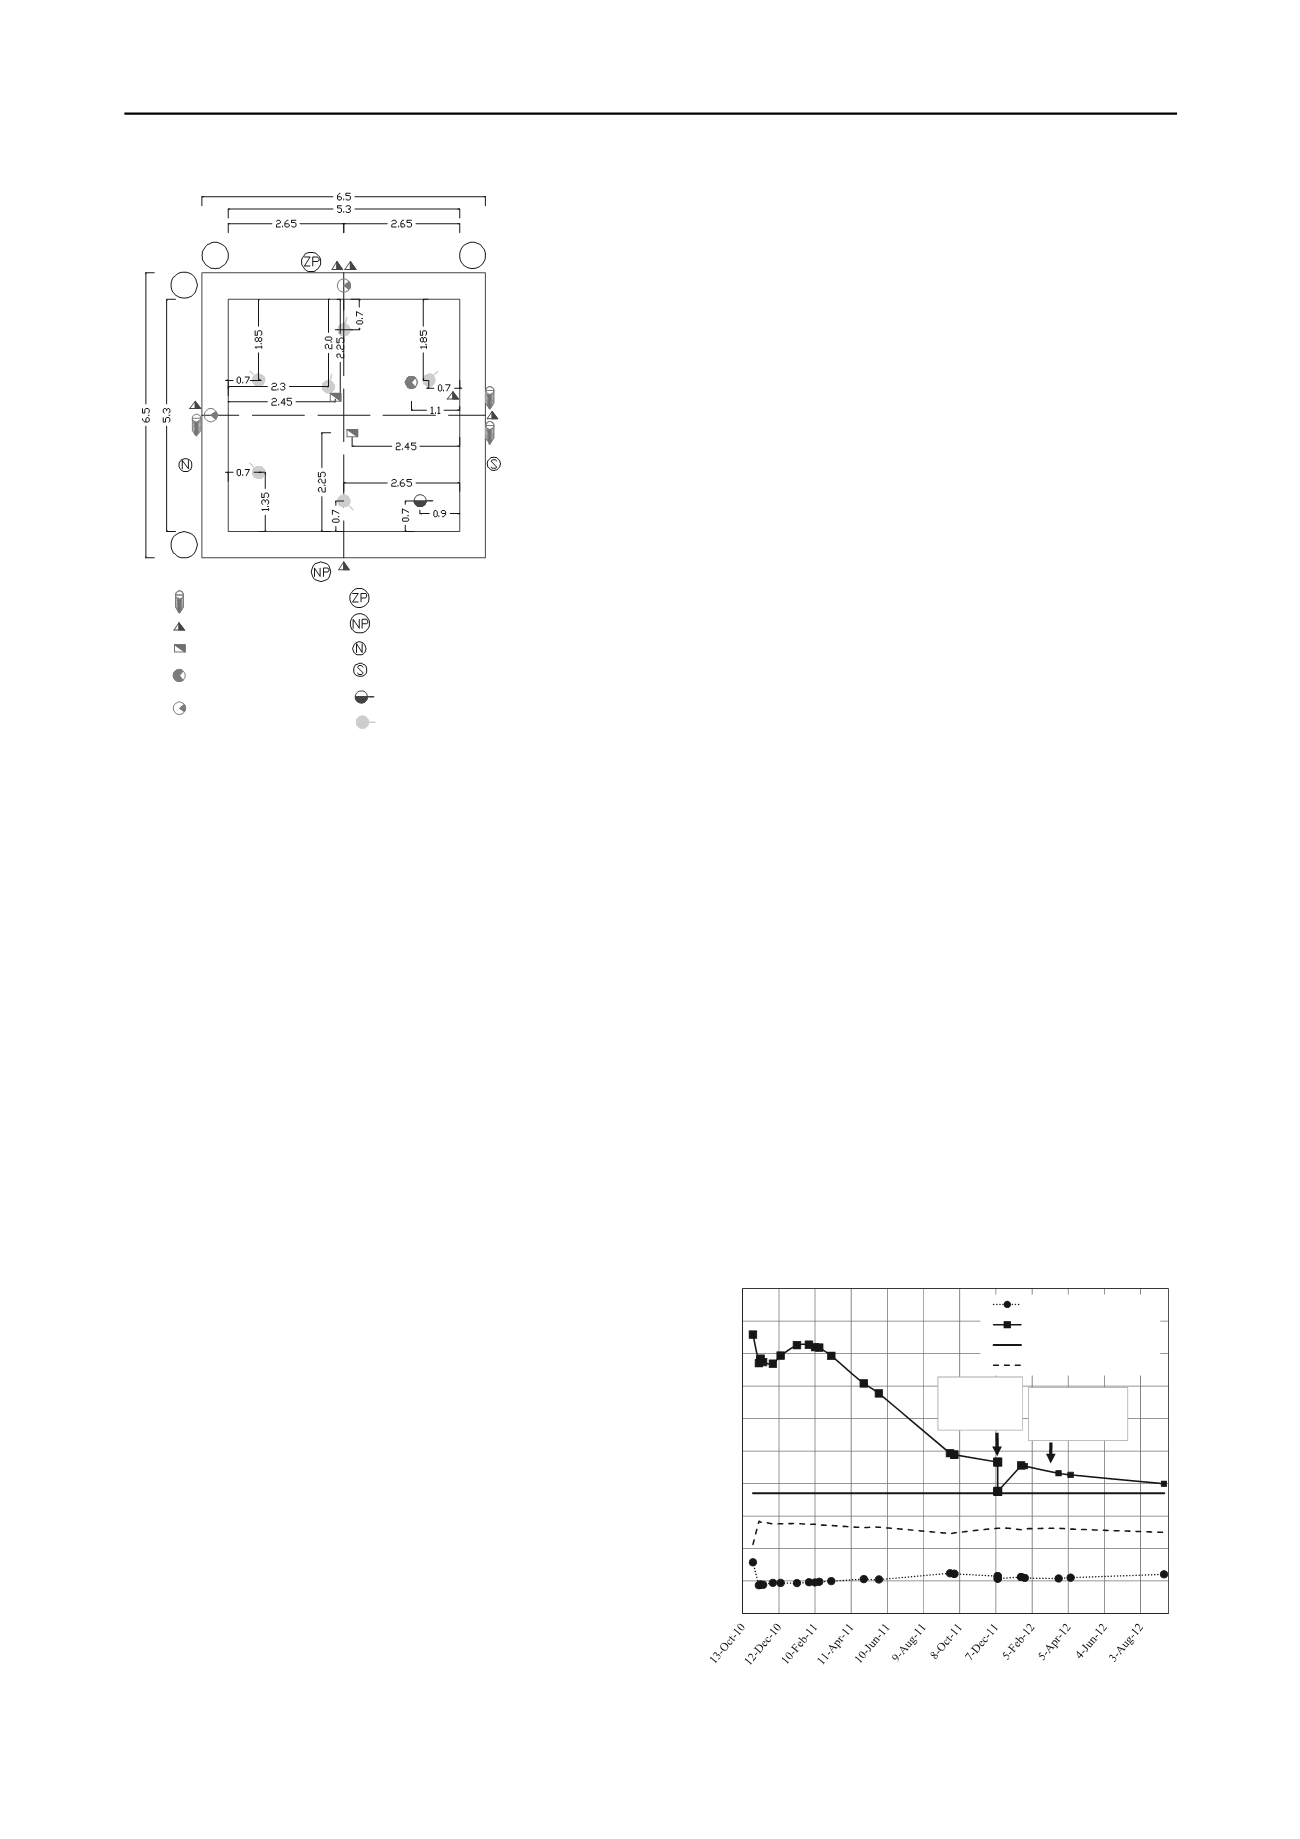
Accel_U-1
Accel_U-2
Accel_T-1
Push-In Pressure cell
Piezometer SG
Triaxial
accelerometer
Uniaxial
accelerometer
Piezometer VW
Pressure cell VW
Pressure cell SG
A
B
1
2
To Zapotitlán station
North
South
To Nopalera station
Figure 4. Sensors layout at the instrumented foundation.
5.4
Accelerometers
Accelerometers were integrated to the structural cell, which
allows knowing information about its movements in case of
seismic events, as well as the forces that those actions exert on
the foundation system. A triaxial accelerometers set (boring
type) was placed in such a way as to record accelerations near
the system’s center in horizontal directions, parallel and
transversal to the tracing axis, and in the vertical direction.
These three sensors were embedded in the precast footing’s
concrete, becoming a trustworthy recorder of its movements. In
addition, two single axis accelerometers were placed in vertical
position, and embedded in the concrete cast in site joining the
footing and the walls. Its location toward the footing’s periphery
intends to distinguish, if there are any, rocking movements of
the system.
5.5
Digital recorder and recording room
The geotechnical sensors and accelerometers described above
will be connected to an automatic digital recording system that
will be activated when a prescribed acceleration threshold is
exceeded due to a seismic event, recording the dynamic actions
on the foundation, with a pre and post event. The digital
recording system has the capacity to capture up to 24 channels
simultaneously, with great precision and at very high speeds;
indeed, it will be usual to record a seismic event with rates of
250 samples per second.
The automatic recording system will also allow maintaining
permanent systematic monitoring in order to know the long
term behavior of the support, thus verifying its structural health.
There is a recording room to which all the cable terminals of the
geotechnical instruments and accelerometers arrive. Over there,
the resistive type and full bridge instruments and accelerometers
will be connected permanently to the automatic digital recorder,
to record their signals in the long-term and during seismic
events. The VW sensors will be manually recorded with
portable units. The digital recorder is properly safeguarded
inside this room, given the valuable information it will be
receiving, and because its own cost. Therefore, the room was
built totally of reinforced concrete and has a metal door with
security locks. It will have a voice and data system to have
remote access to the information via Internet. Solar energy is
used for electric supply to the recording system.
6 SOME ASPECTS OF THE FOUNDATION’S BEHAVIOR
6.1
Evolution of the lateral pressures on the foundation walls
The push-in-cells have provided valuable information to
understand the behavior of this novel foundation, giving
relevant data for future designs. Figure 5 displays the evolution
of horizontal pressure at 9.1 m depth on the exterior side of the
North wall. It can be appreciated that few after the walls were
built, total horizontal pressures are noticeably larger than total
vertical pressures. Also shown is the horizontal pressure
decrease over time, asymptotically tending to a certain value.
With the foundation’s small settlements, and two years after
construction began, the total horizontal pressure’s tendency is to
reach the same value of the vertical pressure. Pore pressure
exhibits small variations, apparently related to seasonal changes
of the water table level.
During the period of almost two years shown in the abscissas
of Figure 5, there were two earthquakes that were not recorded
because the digital recording system was not connected, due to
the recording room had not been finished yet. There was a Mw
6.5 earthquake with epicenter in Zumpango del Rio, Guerrero,
on Saturday night December 10 2011. Next Monday morning,
readings of all the sensors were made, with the lower one for
the day shown; readings recorded a few weeks later show a
clear tendency to continue the one just before the earthquake.
Thus, it has been assumed that there was a sudden and transitory
decrease, as shown in Figure 5, caused by the earthquake.
Nonetheless, it is striking that the more intense earthquake on
March 20 2012, with inland epicenter between the states of
Oaxaca and Guerrero, with Mw 7.4 magnitude, caused no
pressure variation, as shown in Figure 5.
Figure 6 shows the variation of the true coefficient of earth
pressure K, indicating that in the term of two years after the
walls construction, it reaches asymptotic values close to the
unit. Measurements show a total coincidence, which should be
underlined, because the coefficient K is systematically equals to
one in push-in-cells placed at the soil-wall contact, at different
depths. This is equivalent to consider that the effective friction
angle is null at the soil-wall contact in the long term, if we
consider the expressions of the active and passive coefficients,
taking into account the Rankine criteria, or else, that of the
coefficient at rest, as per Jaky’s expression.
Also systematically, the measurements showed the effect of
the December 10 2011 earthquake, its gradual recovery, and
then the null effect on lateral pressures of an earthquake of
larger magnitude. Relatively high values for coefficient K seem
likely, although measurements also exist with spade-shaped
pressure cells such as those described here; values as high as 4.4
(Tedd and Charles, 1982) have been measured in London clay.
0
20
40
60
80
100
120
140
160
180
200
Pressure, kPa
Date
Pore pressure
Total horizontal pressure
Total vertical pressure
Effective vertical pressure
Mw 6.5
earthquake,
Dec 10, 2011
Mw 7.4
earthquake,
March 20, 2012
Figure 5. Evolution of total horizontal and pore water pressures.
PCSG3, push-in pressure cell (N wall, 9.1 m depth below ground level).


