2804
Proceedings of the 18
th
International Conference on Soil Mechanics and Geotechnical Engineering, Paris 2013
PILE
LOAD
TEST
Bored
Pile
d = 2.6m
L= 48 m
Steel
casing to
16 m
O-Cell A
O-Cell B
0
5
10
15
20
25
30
35
40
45
50
55
60
0
5
10 15
Depth (m)
Resistance q
t
(MPa)
C27
C15
0
50 100 150
Sleeve f
s
(kPa)
0 1 2 3 4
Pressureu
2
(MPa)
0 200 400 600 800 1000
Shear Wave V
s
(m/s)
1
10 100 1000
Dissipation t
50
(sec)
C27
C15
C27
Holocene
sands,
silts, and clays
Cooper
Marl
C15
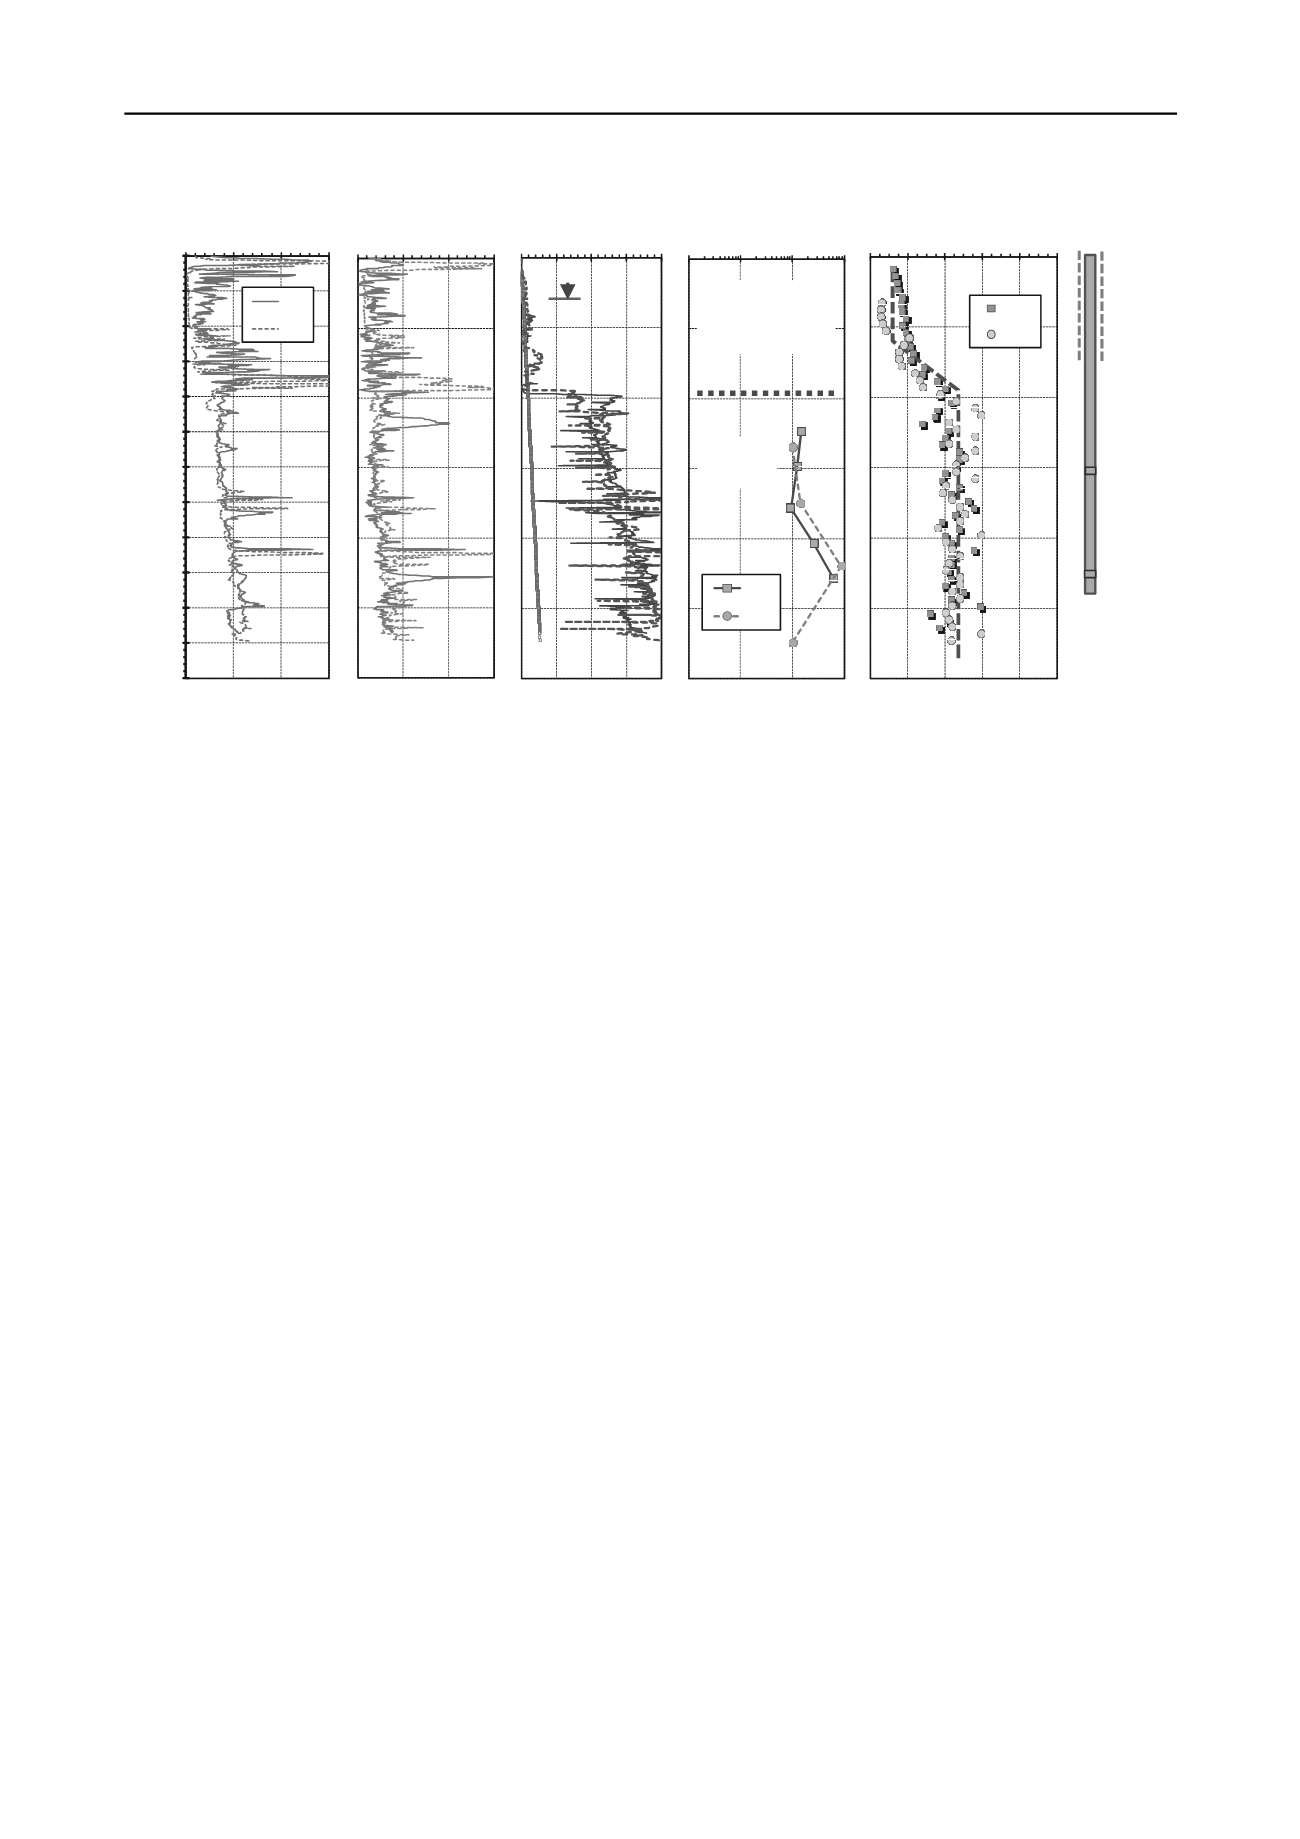
Figure 1.
Soil profile
with two representative seismic piezocone soundings (SCPTu) and O-cell setup for Arthur Ravenel Bridge, Charleston, SC
3 OSTERBERG LOAD TESTING
A fairly comprehensive load testing program of large diameter
bored piles was performed at the site at the direction of the
South Carolina Dept. of Transportation (Camp, 2004). This
included 12 O-cell tests to measure static axial capacities and
displacements. Three test sites were established to represent the
conditions near Charleston, Drum Island, and Mount Pleasant.
The test setup for bored pile load test (MP-1) at the north
end of the bridge at the Mt. Pleasant site had a constructed
diameter d = 2.6 m and embedded length L = 48 m. The upper
16 m was cased with large diameter steel pipe to restrict load
test results for pile side friction within the lower Cooper Marl.
Two levels of Osterberg cells were installed at depths of 30 and
45 m to allow three-stages of loading.
The first stage involved pressurization of the lower O-cell
resulting in a downward movement of the lower pile segment (d
= 2.6 m; L = 2.53 m) while essentially no movement occurred in
the upper shaft portions. Stage 1 involved base mobilization into
the marl to evaluate end bearing resistance plus a small portion
of side friction. The second stage involved pressurization of the
upper O-cell with the lower cell ventilated (open). Stage 2
resulted in a downward motion of the mid-section shaft (d = 2.6
m; L = 14.0 m) with virtually no movements above the
elevation -30 m mark. As such, stage 2 solely involved
mobilization of the side friction in the Cooper Marl.
Finally, stage 3 was conducted by closing the lower O-cell
and pressurizing the upper O-cell to push the top pile segment
upward. Essentially no displacements were recorded in the
lower pile portions (below -30 m). Stage 3 data provided
information on the shear resistance in the Cooper marl in the
non-cased zone from depth intervals from elev. -16 to -30 m.
4 EVALUATION OF AXIAL PILE RESPONSE
4.1
Pile Capacity Assessment
For pile capacity, CPT data can be utilized either directly or
indirectly to assess the end bearing and side components (e.g.,
Eslami and Fellenius 1997; Mayne 2007b). Herein, a rational or
indirect approach was followed using the CPT data to evaluate
geotechnical parameters to determine the pile side friction (f
p
)
and base resistance (q
b
).
For end bearing resistance of piles in clays, limit plasticity
solutions detail that:
q
b
= N
c
∙
s
u
(1)
where N
c
= bearing factor (N
c
= 9.33 for circular pile) and s
u
=
undrained shear strength. For a mode corresponding to direct
simple shear (DSS), the strength can be obtained from:
s
u
= ½ sin
'
∙
OCR
∙
vo
'
(2)
where
vo
' = effective overburden stress, exponent
= 1 - C
s
/C
c
≈
0.8, C
s
= swelling index, and C
c
= compression index. In
clays, an evaluation of the overconsolidation ratio from CPT
data using the expression:
OCR = ⅓ Q
(3)
where Q = (q
t
-
vo
)/
vo
' = normalized cone tip resistance. The
CPT data indicate OCRs decreasing from 6 to 3 which are
slightly higher than OCRs from the noted
v
' = 480 kPa.
The effective stress friction angle in clays can be evaluated
from piezocone results using an effective stress limit plasticity
solution developed by Senneset, et al. (1989). A simplified form
can be expressed (Mayne, 2005):
' = 29.5
°∙
B
q
0.121
[0.256 + 0.336
∙
B
q
+ log Q]
(4)
where B
q
= (u
2
-u
0
)/(q
t
-
v0
) = normalized excess porewater
pressure. The equation is applicable for the following ranges:
20º ≤
' ≤ 45º and 0.1 ≤ B
q
≤ 1.0. For the Cooper Marl, the
CPTu results indicate an effective
'
≈
43º, quite comparable to
values measured from laboratory CIUC triaxial tests on
undisturbed samples (Mayne 2005).
The corresponding calculated values of pile end bearing
resistance using equations (1) through (4) are presented in
Figure 2 as a function of
vo
'. The q
b
increase from 2 to 4 MPa
and compare quite well with the measured values evaluated
from the O-cell test results.
The pile side resistance (f
p
) can be expressed in terms of the
lateral stress coefficient (K
0
) and interface friction between the
pile surface and surrounding soil. As a first approximation, this
"beta" method gives:
F gure 1. Soil profile with two representative se smic piezocone sounding (SCPTu) and O-cell s tup for Art u Ravenel Bridge, Charleston, SC


