2796
Proceedings of the 18
th
International Conference on Soil Mechanics and Geotechnical Engineering, Paris 2013
Brisbane River and generally has Holocene (young)
overlying the Pleistocene (older) Alluvium.
2 STATISTICAL ANALYSIS OF DATA
Look and Wijeyakulasuriya (2009) carried out a statistical
review of the intact rock strength data at Piers 6 and 7 for the
sub-horizontally interbedded sedimentary layers at the GUP
site, and defined Point Load Index (I
s(50)
):UCS ratios of 40 and
25 for diametral and axial orientated I
s(50)
tests respectively.
This highlighted the need to account for strength anisotropy in
the rock socket design, due to the radial normal stresses on the
socket wall. Via use of goodness-of-fit tests, Look et. al. (2004,
2009) has demonstrated that the use of non-normal distribution
functions for describing rock strength datasets produces more
realistic characteristic strength values than comparable values
based on assumption of a Normal distribution. Use of a Normal
distribution was reported to produce unrealistically low, or even
negative, values at low percentile values of the rock strength.
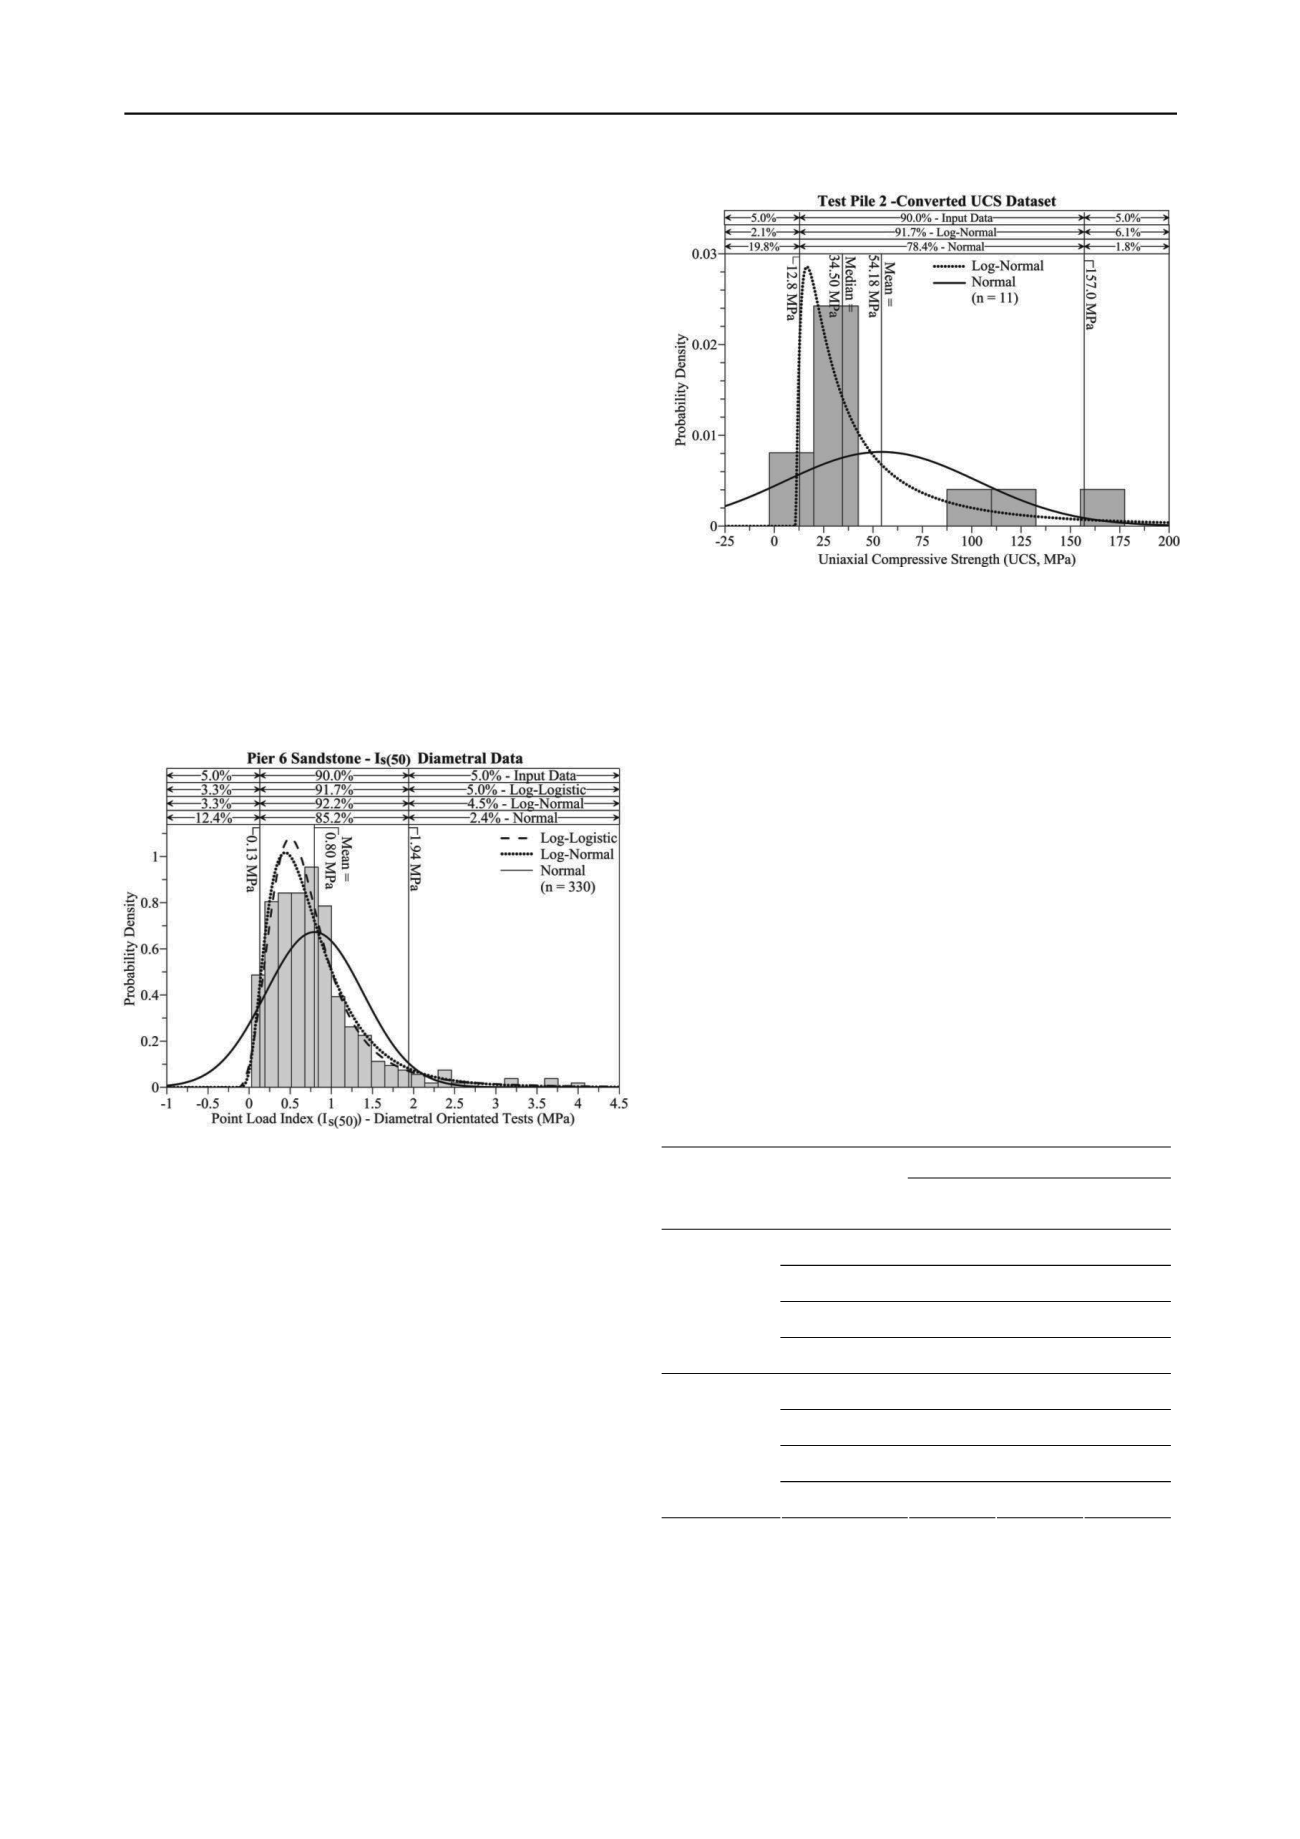
Figure 1 compares the best fit distribution (Log-logistic)
with the better known Log-normal and Normal distributions for
all Pier 6 diametrally orientated I
s(50)
values completed in the
interbedded sandstone layer (
n
= 330). The Log-normal
distribution, while not the best fit, is observed to provide a
much closer fit to the dataset than the Normal distribution does.
Figure 1. Distribution Functions compared for Pier 6 I
s(50)
data (
n
= 330)
2.1
Characterisation of rock strength
The test piles, TP1 and TP2, were completed upon the south and
north riverbank respectively (~600m apart). TP1 was located
approximately 160m from the location of Pier 6. Strength data
was compiled by conversion of I
s(50)
values of tests completed
along of the length of the instrumented pile to equivalent UCS
values via use of the site calibrated conversion ratios of 25 and
40. Figure 2 compares statistical distribution functions fitted to
the equivalent UCS strength results applicable TP2. Similar
distribution fitting was also completed independently for TP1.
Tests related to TP2’s rock socket indicated the presence of
higher strength sandstone layers than encountered in TP1,
which illustrated the localised material variation within the
geological sequences that existed below the bridge footprint.
Both non-normal and Normal distribution functions were
fitted to each test pile’s strength dataset through application of
the Anderson-Darling goodness-of-fit test. The resultant UCS
values for selected fractiles of the fitted non-normal and Normal
distributions are detailed in Table 2 for each test pile. At low
percentile values (TP1 ≤ 15
th
percentile; TP2 ≤ 10
th
percentile),
the use of a Normal distribution function would output a
negative “characteristic” design value. This supports the
assertion that a non-normal distribution is most appropriate for
use in characterising rock strength data for this site.
Figure 2. TP2 strength dataset – Log-normal and Normal distributions
Table 2 also shows the localized variation in rock strength
for the interbedded sandstone layer. Numerical similarity is not
apparent between TP1 and TP2, and the comparatively low
number of strength tests available for each test pile should also
be noted. Pier 6 can be considered geologically similar to TP1,
in both strength data and as both were logged as having deep
alluvium overlying rock. If a single characteristic rock strength
value was selected to represent the entire GUP site, the location
of the value upon the derived strength profiles would vary. If,
arbitrarily, 10MPa was selected as the design characteristic rock
strength, this could represent either the 40
th
or 30
th
percentile,
depending on the distribution applied to the TP1 dataset, or
either the 5
th
or 20
th
percentile for the TP2 rock strength data.
The data presented herein demonstrates that the choice of
distribution function used to define such fractiles plays a critical
role in the calculated design value, especially within the lower
percentiles (below the 20
th
percentile). As the shear capacity of
a rock socket is largely defined by the design rock strength, the
selection of the distribution function applied to calculate the
characteristic strength value can thus potentially have a large
impact upon the resulting pile design and the required length of
rock socket to withstand the design load.
Table 2. Test Piles UCS distribution
UCS (MPa)
Distribution
Percentile
TP1
n
= 8
+
Pier 6
n
= 330
*
TP2
n
= 11
+
10%
-11.5
0.9
-8.4
25%
9.2
9.9
21.2
Median (50%)
32.1
19.9
54.2
Normal
75%
55
29.9
87.1
10%
4.3
5.9
15.8
25%
7.2
10.0
21.3
Median (50%)
14.4
16.4
34.3
Non-normal
75%
35.2
25.8
63.2
+
Over length of Pile Shaft;
*
in equivalent interbedded sandstone layers
Approximate “equivalency” between the non-normal and
Normal distributions occurs at the 25
th
percentile. Thus, if the
inconsistencies associated with use of inappropriate distribution
functions are to be minimised then the adopted design UCS
value should be close to, or at, this fractile.
2.2
Full Scale Load Tests
Osterberg Cell (O-Cell
TM
) data was recorded during cyclical
loading / unloading of the two 1.2m diameter test piles. The


