2793
Technical Committee 212 /
Comité technique 212
with granular material were fully saturated leading to extreme
softening (swelling) of the clay in the base of the excavations.
A total of five ~10m deep CPTs were used to characterise
the site and backfill. Using a N
kt
= 20 (Butcher et al. 2009) the
variation of s
u
and density (γ) of the London clay below 3m (the
founding plane) corroborates with previous observations. A
profile from Footing 5 is shown in Figure 2.
Figure 2. CPT profile of Footing 5
2.3
Load schedule
The footings tests were carried out over a period of six working
days (18
th
- 25
th
July 2012). Table 3.2 shows the order with
which the tests were carried out. The small displacement tests
(denoted ‘A’) of Footings 2 and 3 examined the rate effect at
small displacements in the fully bonded and breakaway
conditions. The first load test on Footing 4 was a design test to
BS EN61773:1997 (BSI 1997).
The load was applied to the footing stubs using a hydraulic
jack system. The setup of the reaction beams and jack is shown
in Figure 3. The reaction beams at the base were orientated
parallel to the line of the excavations and outside the failure
zone of a 30
o
frustum. The cross beams with the hydraulic jack
were inclined so that the footings could be pulled up in line with
the footing chimney. Wedges were placed under the cross beam
to achieve the required rake angles. The hydraulic ram had a
total stroke length of 150mm (w/B=10%).
The resistance of the footing during uplift was measured
using a load cell mounted above the hydraulic jack. The
displacement of the footing was measured by mounting LVDTs
on a reference beam. The LVDTs were vertically orientated and
recorded the movement from the head of the chimney. The data
from the instrumentation was acquired using a Campbell
CR5000 data logger sampling at 10-100s/s.
3 FIELD TEST RESULTS
3.1
Load-displacement behavior
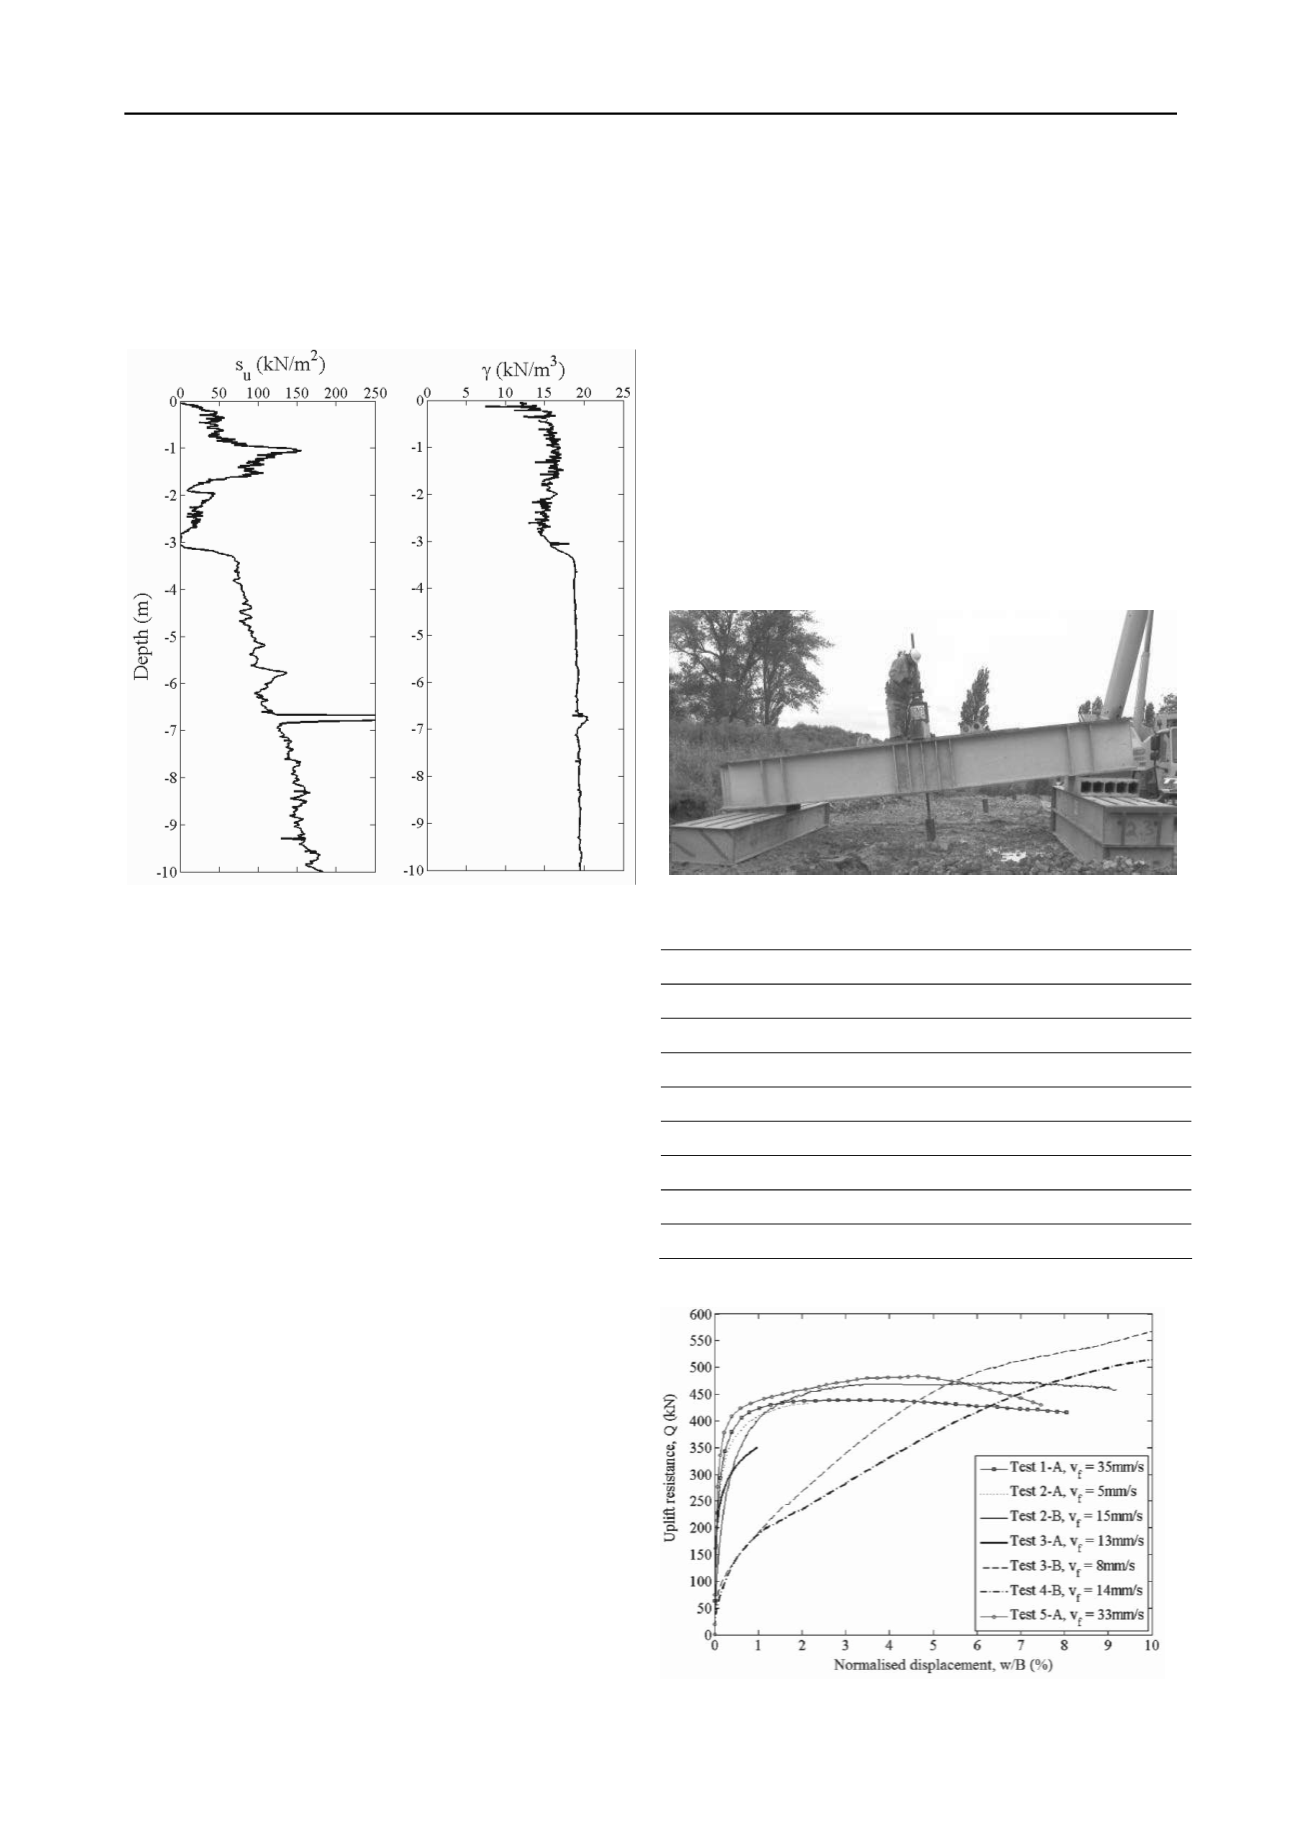
The load-displacement profiles of the tests conducted with a
London clay base displayed an extremely stiff response (see
Test 1-A and 5-A.
The loading rates during the first few millimetres of
movement was in the range 276 kN/mm (Test 2-A) – 333
kN/mm (Test 1-A). The peak capacities of the footings were
achieved between w/B = 2.1 - 4.7% versus the secondary test
which were generally in excess of 7%. Although the Tests 1-A,
did not affect uplift capacity. The measured uplift capacities
were similar for both tests (<10% difference) during the first
10mm of uplift and at peak there is a difference of 50 kN versus
Test 1-A and 5-A.
Test 3-A was
2-A and 5-A were conducted at different uplift velocities this
used to examine the difference that base
co
gr
Ta 2. Load schedule
est
w (mm)
v
f
(mm/s)
ntact conditions at small displacements would have. Although
the test did not reach its peak the stiffness response is
comparable with Footing 2-A. This implies that the base
condition contribution was similar to the footings tested on
London clay and that the blinding did not fulfill its purpose of
excluding suctions from uplift i.e. acted a free draining material.
Tests 3-B and 4-B indicated that the performance of Type 2
anular fill is extremely poor and could only mobilise ~50% of
Q
des
at w=10mm. Large displacements were required for the
granular fill to mobilise sufficient strength to produce uplift
capacities equivalent to Q
des
(w = 60mm Test 3-B and w =
80mm Test 4-B). It should be noted on Test 5-A reached Q
des
within a 10mm displacement.
Figure 3. Field test arrangement
ble
Footing
T
1
1-A
150
35
2
2-A
15
5
2
2-B
150
15
3
3-A
15
15
3
3-B
150
10
4
4-A
BS EN61773:1997
4
4-B
150
15
5
5-A
150
35
Figure 4. Load-displacement results for rapid uplift footings


