2790
Proceedings of the 18
th
International Conference on Soil Mechanics and Geotechnical Engineering, Paris 2013
Proceedings of the 18
th
International Conference on Soil Mechanics and Geotechnical Engineering, Paris 2013
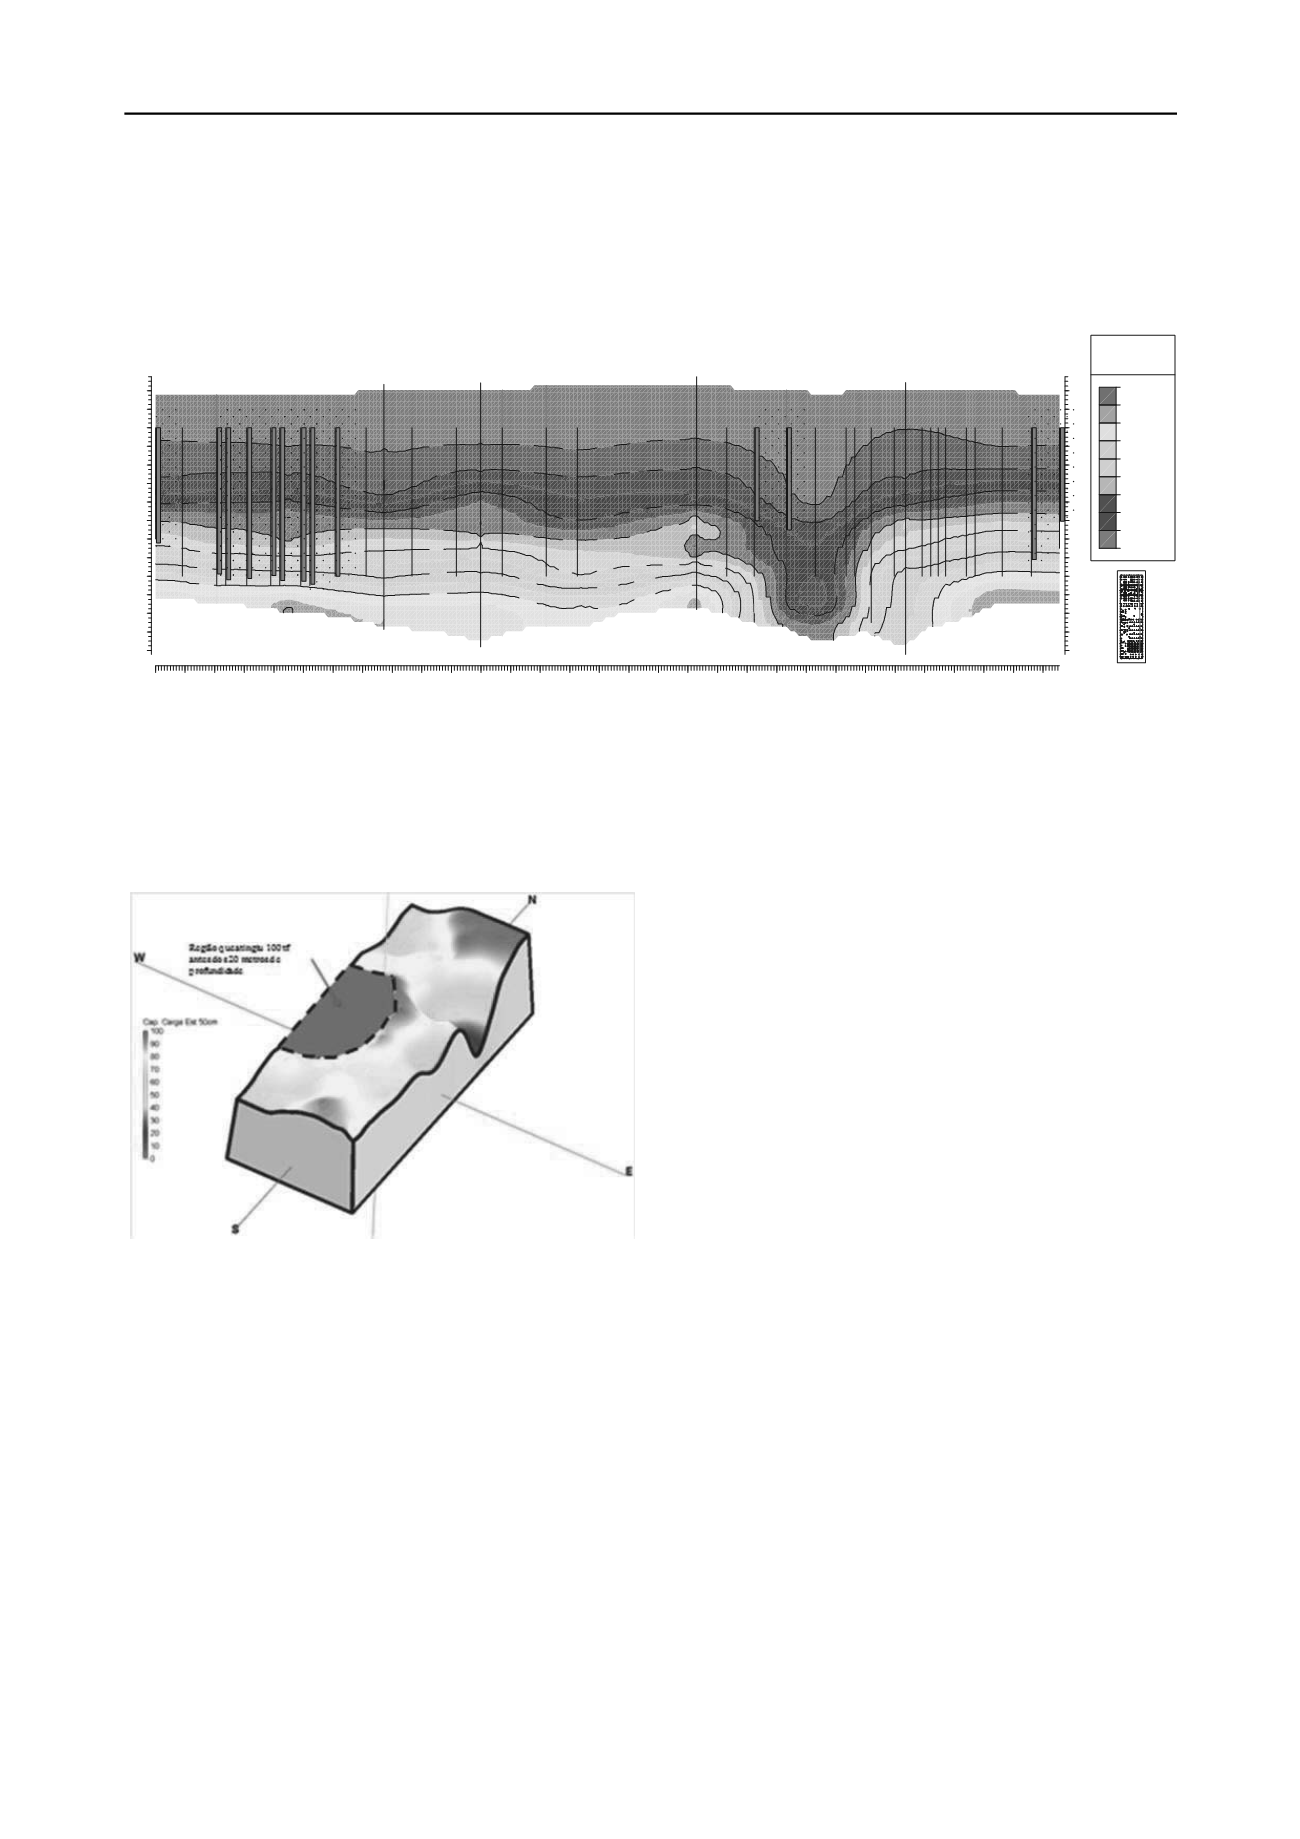
Most of the piles of interest which were to be executed in
the construction had a depth of 20 m (length) with a prevailing
diameter of 50 cm for 100 tf of bearing capacity, had their
execution in terms of depth defined by the elaborated models.
The objective of the 2D sections of bearing capacity, which
in the beginning was just to do the depth control reached by the
execution, took new destinations when many piles start to
present problems during the excavation. Figure 6 shows a
section of interest for the construction in which some piles
presented execution problems.
Figure 6. Section 1-1 of bearing capacity of the case study
3.3
Horizontal Sections (2D) of Bearing Capacity
The horizontal sections 2D of bearing capacity are very useful
to see the results in a general way. Figure 7 shows the bearing
capacity (tf), for 50 cm diameter and 16 meters depth and
Figure 24 shows the bearing capacity surface for 20 meters
depth, and those are in reality what can be called as 2,5D
surfaces.
Figure 7. Horizontal Section of Bearing Capacity for 20meters depth
of the case study.
The choice of the 20 meters depth was due to the fact to
achieve most of piles in terms of bearing capacity and because
many piles did not reach longer depths, once they were getting
close to the maximum excavation limit of the equipment.
Finally it can be observed how often the resistant surface
can vary in the construction and how can the models help in the
problem analysis and in the search of more efficient solutions
for the construction.
4 CONCLUSIONS
The three-dimensional mapping of the soil has the target to
obtain the maximum knowledge of the geotechnical conditions
of the construction location to make the engineers’ analyses
easier. On the contrary of traditional methods, the data
interpolation during the 3D modeling process decrease the
uncertainties of the natural variability of the soil.
The propose to produce a bearing capacity model was
extremely satisfactory and with a practical value, however we
must be careful in taking into account the traditional methods
and the field tests, as the static load tests, with the objective to
calibrate the bearing capacity model. Besides, the construction
control with the spacialization of the design foundations and the
executed ones, in the bearing capacity model, diminish a great
deal the uncertainties in the construction and promote a greater
economy for the foundation execution..
The process of post-evaluation of the models produced by
the computer softwares must always be done with criterion.
That is, the whole process of three-dimensional modeling of
sub-surfaces
or
underground
space
requires
geological/geotechnical experience of the region and knowledge
of limitations and potential advantages of the computer
softwares as the quantity of input attributes, working grid limit,
interpolating devices and their limitations.
5 REFERENCES
DÉCOURT , L.; QUARESMA, A. R. Capacidade de Carga de estacas a
Partir de Valores de SPT. 6º Congresso Brasileiro de Mecânica dos
solos e Engenharia de Fundações, Rio de Janeiro, anais, v. 1, pp 45-
53, 1978.
FARIA, A. (1995). Estratigrafia e Sistemas Deposicionais do Grupo
Paranoá nas Áreas de Cristalina, Distrito Federal e São João
D'aliança - Alto Paraíso De Goiás. Tese de Doutorado, 4, Instituto
de Geociências, Universidade de Brasília, Brasília, DF, 199 p.
SILVA, C.M. (2011). Energia e Confiabilidade Aplicadas aos
Estaqueamentos Tipo Hélice Contínua. Tese de Doutorado,
Publicação G.TD - 070/11, Departamento de Engenharia Civil e
Ambiental, Universidade de Brasília, Brasília, DF, 303p.
SILVA, C. P. L. & SOUZA, N. M. (2009). Desenvolvimento de
Modelagem
Tridimensional
de
Subsuperfícies.
Livro
Comemorativo dos Vinte Anos do Programa de Pós-Graduação em
Geotecnia da Universidade de Brasília. Editora FT, ISBN 978-85-
60313-15-0, Brasília, DF, 441-470 p.
SILVA, C. P. L. (2011). Cartografia Geotécnica Tridimensional do
Setor Noroeste de Brasília. Tese de Doutorado, Publicação G.TD-
072/2011, Departamento de Engenharia Civil e Ambiental,
Universidade de Brasília, Brasília, DF, 274 p.
10tf
20tf
40tf
60tf
80tf
10tf
40tf
80tf
100tf
120tf
10tf
20tf
40tf
60tf
80tf
10tf
20tf
40tf
60tf
80tf
100tf
120tf
10tf
20tf
60tf
100tf
120tf
10tf
20tf
40tf
60tf
80tf
10tf
10tf
10tf
20tf
20tf
20tf
40tf
40tf
40tf
60tf
60tf
60tf
80tf
80tf
80tf
100tf
100tf
120tf
120tf
120tf
10tf
20tf
40tf
80tf
40tf
40tf
80tf
10tf
20tf
40tf
60tf
80tf
10tf
20tf
40tf
60tf
PC2
P324
P2-C
P2-A
P9-C
P17-C
P17-B
P25-C
P25-A
P310
P236
SP-17-Verano
P230
P224
SP-18-Verano
P218
P212
P206_P125
SP-20-Verano
P108
P443
P437
P431
P223-C
P223-A
P220-C
P217-C
SP-12-Blanc
P212-B
P210-C
P210-B
P210-A
P207-D
P207-B
P411
P405
P705
1
1'
-28.0 -26.0 -24.0 -22.0 -20.0 -18.0 -16.0 -14.0 -12.0 -10.0 -8.0 -6.0 -4.0 -2.0 0.0
-28.0 -26.0 -24.0 -22.0 -20.0 -18.0 -16.0 -14.0 -12.0 -10.0 -8.0 -6.0 -4.0 -2.0 0.0
0.0
5.0
10.0
15.0
20.0
25.0
30.0
35.0
40.0
45.0
50.0
55.0
60.0
65.0
70.0
75.0
80.0
85.0
90.0
95.0
100.0
105.0
110.0
115.0
120.0
125.0
130.0
135.0
140.0
145.0
150.0
Seção 1-1' - Cap. Carga Est. 50 cm
CapCarga(tf)-Est.50cm
180
160
140
120
100
80
60
40
20
0
1
1'
0.0
25.0
50.0
75.0
100.0
125.0
150.0
Oeste
0.0
25.0
50.0
75.0
100.0
125.0
150.0
Leste
0.0
25.0
50.0
Sul
0.0
25.0
50.0
Norte


