2780
Proceedings of the 18
th
International Conference on Soil Mechanics and Geotechnical Engineering, Paris 2013
Table 1 Construction activities and dates for Ceintuurbaan
Construction activity
End date
Base monitoring start 2001
2003-11-01
Preliminary activities
2007-04-01
Excavation to NAP –6.2m
2007-09-13
Excavation to NAP –15.3 m
2007-12-10
Excavation to NAP –19.4 m
2008-03-01
Excavation to NAP –24 m
2008-08-01
Excavation to NAP –25.6 m,
Floor construction, pumping test
2009-06-24
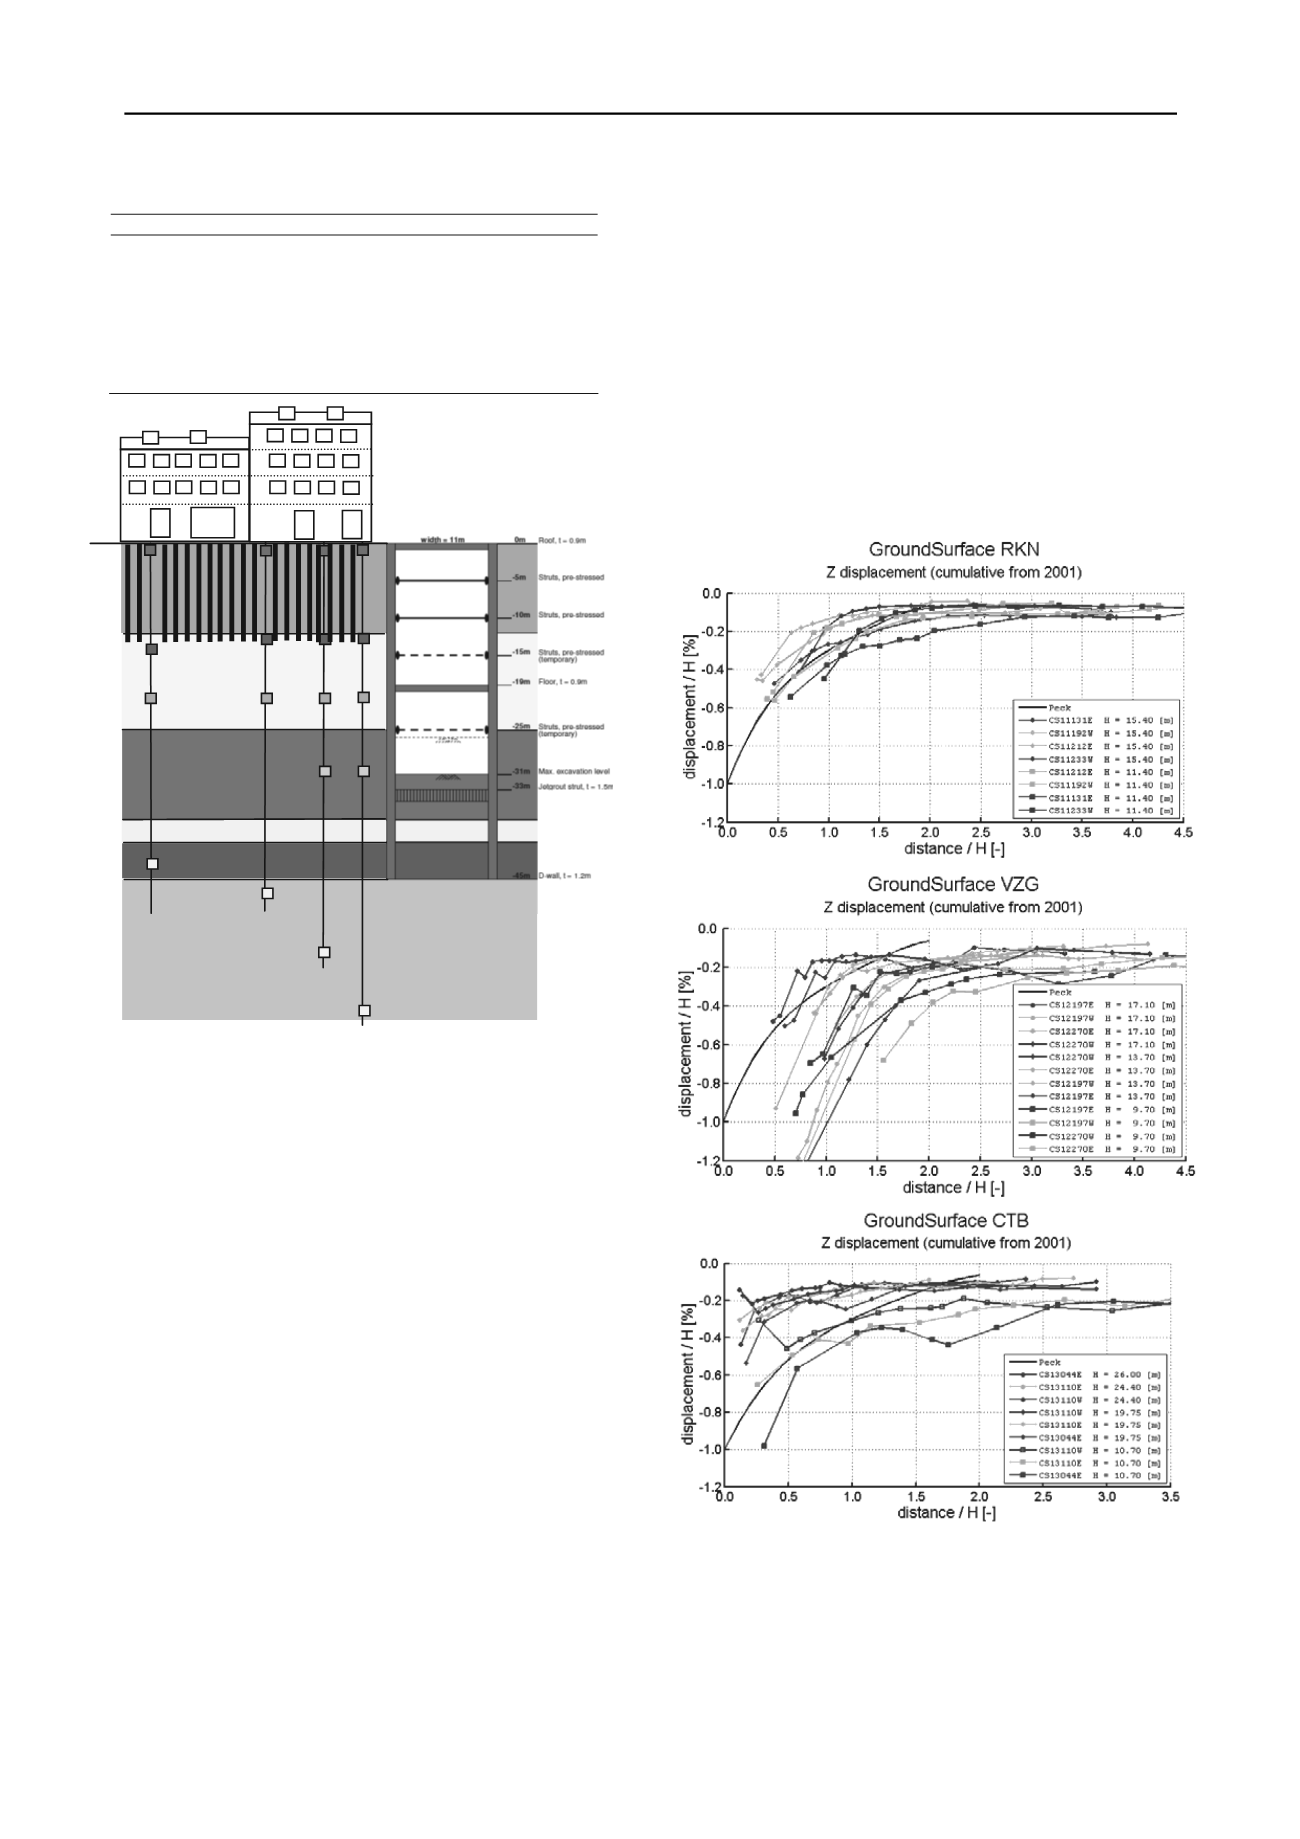
Figure 2 Cross section of Ceintuurbaan Station with soil profile and
extensometer locations
2 SURFACE DISPLACEMENTS
In the Amsterdam deep excavations, the following construction
effects contributed to the displacement of the ground surface:
• Installation of diaphragm wall including preliminary
activities
• Excavation of the station box.
Figure 3 shows the measurements of the ground surface for
all three stations, Rokin, Vijzelgracht and Ceintuurbaan, for
various stages of the excavation. It should be noted that the
excavations had not finished at the time these measurements
were taken and so the long term consolidation settlement is not
completely included. The total period of the displacement
measurements was over 6 years (from 2003-2009). For each
stage, the excavation depth H is mentioned in the figures. From
Figure 3 it is concluded that the settlement profile found in
Amsterdam falls within the limit of Zone 1, as described by
Peck (1969), with the ground surface displacement falling
within 1% of the excavated depth. The main displacements
occur within 2 times the excavation depth as also suggested by
Peck. More significant however is the effect of the excavation
depth itself. In all three of the Amsterdam cases, the largest
effect on the ground surface can be attributed to the preliminary
activities, which took in total about 4 of the 6 year
s
presented.
For each station, the average contribution of the preliminary
activities to the surface displacements has been determined. The
percentage of displacement caused by preliminary activities in
2003-2007 compared to the overall displacement between 2003-
2009 or 2003-2010 for Ceintuurbaan Station is 70%. For
Vijzelgracht Station this is 55% and for Rokin Station 74%. The
percentage at Vijzelgracht is influenced by some leakage
incidents (Korff et al. 2011), showing a larger effect during the
excavation period after 2007. The percentages for all the
stations are somewhat higher than the actual values would be if
the displacements at the end of construction (after 2012) had
been taken into account, although additional displacements
between 2009-2012 have been very small. Such a high
percentage of the settlements caused by preliminary activities
was also reported by Fernie et al. (2001) for a case study in
London (Harrods). The deflection of the retaining wall in a top-
down construction there caused only a small fraction of the
overall ground movements. The installation of a contiguous
piled wall of bentonite-cement caused up to 40% of the total
movement.
1st and 2nd
sandlayers
Eemclay
Intermediate sandlayer
Glacial clay
3rd sandlayer
Figure 3 Settlements normalized with excavation depth H, compared
with envelopes by Peck (1969)
Clough and O’Rourke (1990) evaluated the maximum
displacement to be expected behind different types of retaining
walls. In stiff clays, residual soils and sands the maximum
ground displacement behind the wall is about 0.15% - 0.5% of
the excavation depth, see Figure 4. The Amsterdam cases are
plotted in a similar way in Figure 5.


