 
          2772
        
        
          Proceedings of the 18
        
        
          th
        
        
          International Conference on Soil Mechanics and Geotechnical Engineering, Paris 2013
        
        
          Although a full three dimensional (3D) analysis is preferable
        
        
          when studying problems involving piles, in the present study a
        
        
          two dimensional (2D) approach under axisymmetric conditions
        
        
          was used in order to reduce the computation time. This means
        
        
          that, even though the real raft shape was rectangular, a circular
        
        
          raft was simulated. The raft had a radius of 2.257 m, giving it
        
        
          the same area as the real raft. The pile had a radius of 600 mm
        
        
          and was straight, with no base enlargement. From the top
        
        
          surface, the simulated soil layers were clay 1 (4 m), sand 1 (4
        
        
          m), sand 2 (13.5 m), clay 2 (6.5 m) and clay 3 (12 m), as shown
        
        
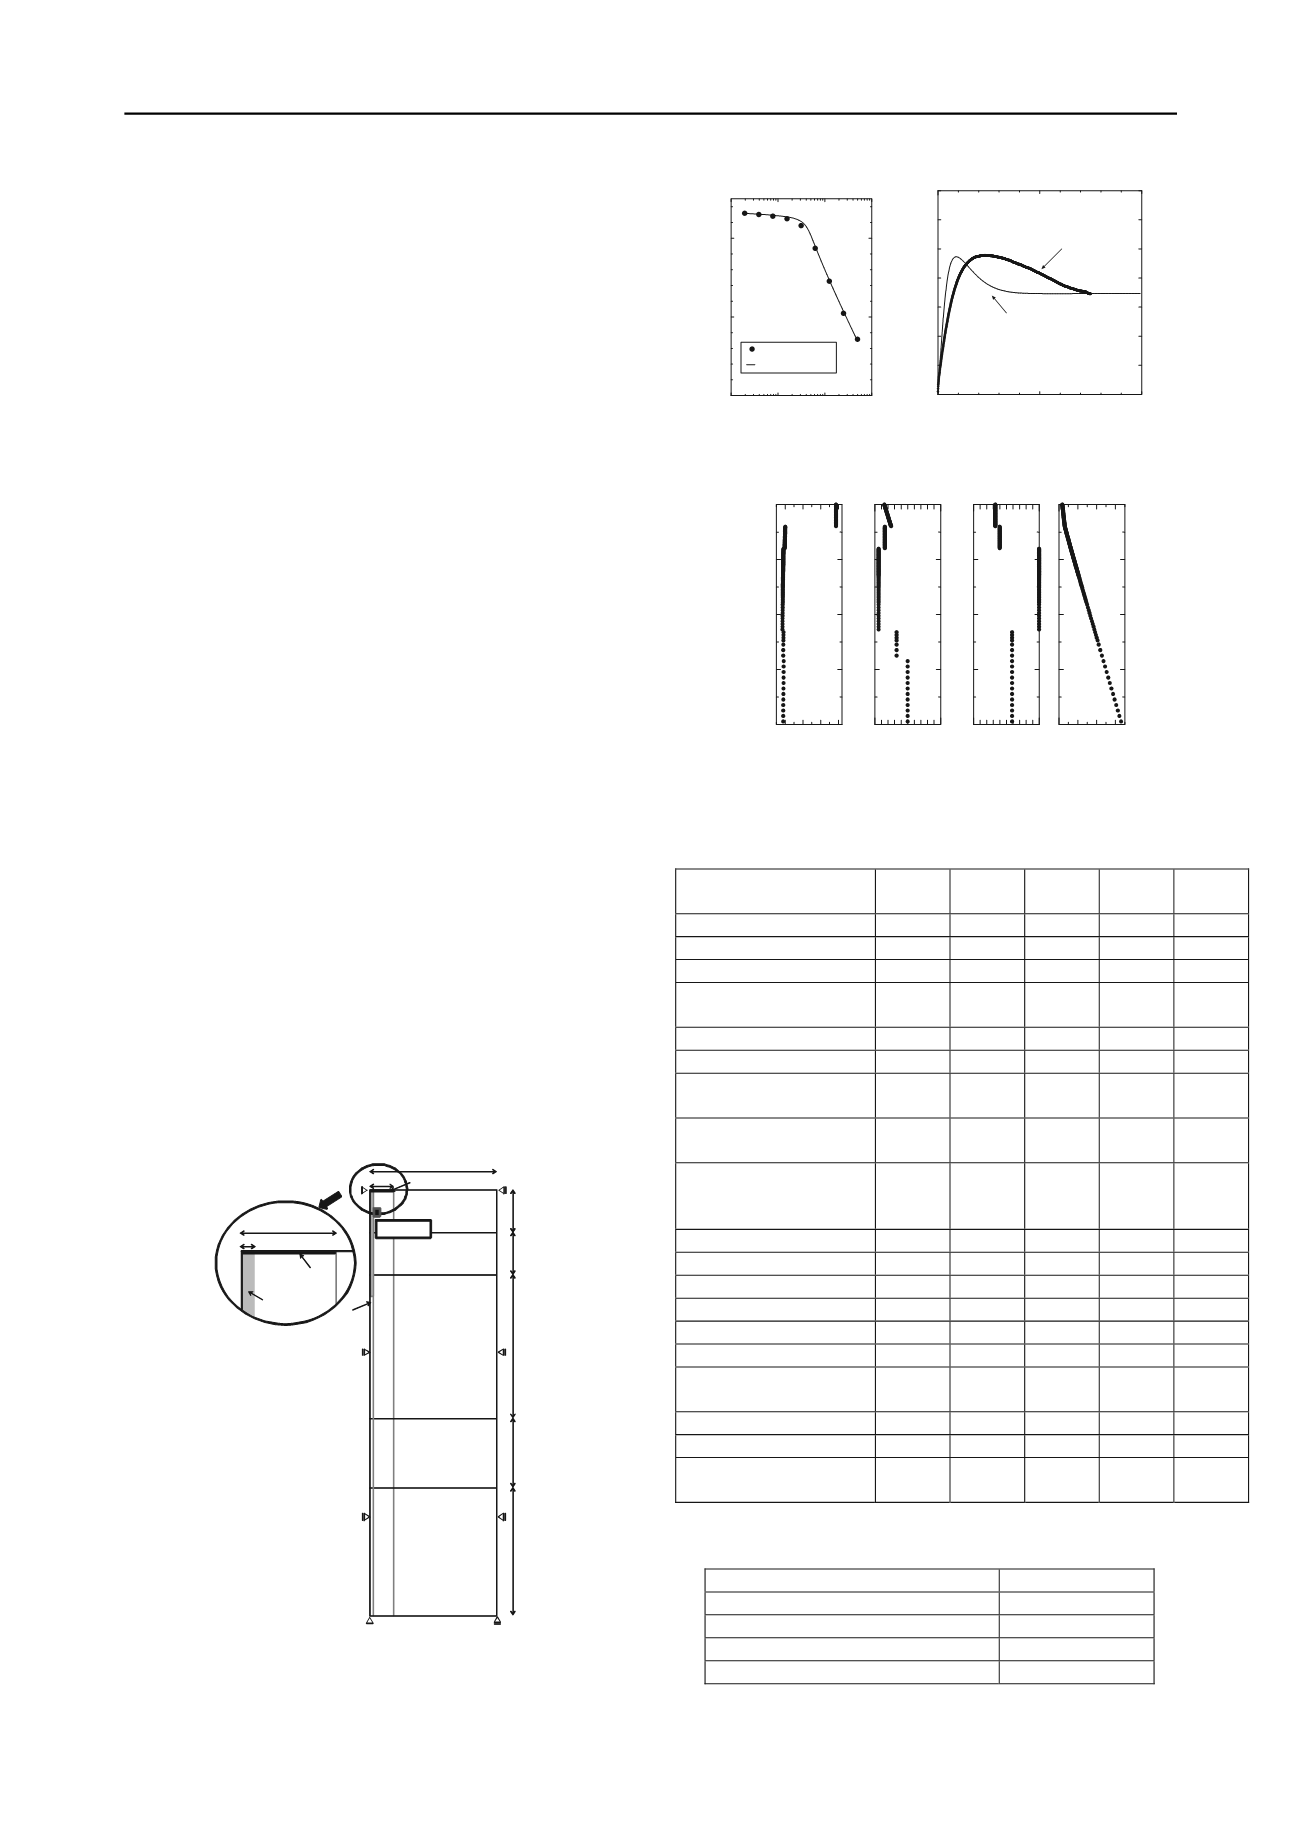
          in figure 2. The material parameters were determined by
        
        
          consolidation testing of clay 1 and drained triaxial compression
        
        
          testing of sand 2. Figures 3a (clay) and 3b (sand) compare the
        
        
          simulated and laboratory test results. For clay, the simulated and
        
        
          experimental results agree well, but for sand, the initial
        
        
          simulated modulus differs from the experimental data. This is
        
        
          because the parameters of the simulated sand were chosen to
        
        
          allow later simulation of a loading experiment. Table 1 shows
        
        
          the soil material parameters. Due to the lack of experimental
        
        
          data, some of the material parameters for clays 2 and 3 were set
        
        
          to be the same as those for clay 1, but with different initial void
        
        
          ratios. Similarly, some of the material parameters for sand 2
        
        
          were set to be the same as those for sand 1. Table 2 shows the
        
        
          pile material properties, which correspond to the typical linear
        
        
          elastic parameters of pre-stressed high-strength concrete. Figure
        
        
          4 shows the initial simulated soil profile. A load of 19.2 kPa
        
        
          was applied to the soil surface at the raft position to simulate the
        
        
          load of the raft. Displacement of raft elements in the x direction
        
        
          was restrained, but displacement in the y direction was allowed.
        
        
          The stratified soil model was first prepared, after which
        
        
          elements with properties corresponding to the pile material were
        
        
          added. This was done while taking into account the force
        
        
          equilibrium between the soil and pile elements. After the excess
        
        
          pore pressure dissipated, a vertical displacement was applied to
        
        
          the pile elements for the three different cases: Case 1 models the
        
        
          raft alone, Case 2 models the pile alone, and Case 3 models the
        
        
          piled raft foundation. Figure 5 shows the step loading process
        
        
          followed during the actual physical experiment. The bearing
        
        
          capacity is dependent on the loading speed as well as the load
        
        
          magnitude. In the simulation, even though cyclic loading was
        
        
          not taken into consideration, the loading rate was set to a fixed
        
        
          value of 0.01 mm/sec in consideration of the final 10 cm
        
        
          settlement (Kaneda


            et al.


          (2012)).
        
        
          4m
        
        
          4m
        
        
          13.5m
        
        
          6.5m
        
        
          12m
        
        
          clay1
        
        
          sand1
        
        
          sand2
        
        
          clay2
        
        
          clay3
        
        
          11.9m
        
        
          2.257m
        
        
          0.3m
        
        
          2.257m
        
        
          pile
        
        
          pile
        
        
          raft
        
        
          raft
        
        
          Aelement
        
        
          Figure 2: Boundary conditions
        
        
          10
        
        
          1
        
        
          10
        
        
          2
        
        
          10
        
        
          3
        
        
          10
        
        
          4
        
        
          1
        
        
          2
        
        
          3
        
        
          Vertical Pressure (kPa)
        
        
          Void Ratio
        
        
          Experimantal data
        
        
          Simulation
        
        
          10
        
        
          20
        
        
          0
        
        
          200
        
        
          400
        
        
          600
        
        
          Axial strain (
        
        
          %
        
        
          )
        
        
          Deviator stress (kPa)
        
        
          Experimental data
        
        
          Simulation
        
        
          (a) Clay 1                (b) Sand 2
        
        
          Figure 3: Experimental and simulation results
        
        
          1 2 3 4
        
        
          0
        
        
          20
        
        
          40
        
        
          0 0.5 1 0 0.5 1
        
        
          0 100200300
        
        
          Void ratio


            e


            R


          (=1/O.C.R.) State of structure
        
        
          Height (m)
        
        
          Vertical Stress


            R


            *


          σ


            v


          (kPa)
        
        
          Figure 4: Initial soil conditions
        
        
          Table 1: Material properties of soils
        
        
          <Elasto-plastic
        
        
          parameter>
        
        
          Clay 1
        
        
          Sand 1
        
        
          Sand 2
        
        
          Clay 2
        
        
          Clay 3
        
        
          Compression index λ
        
        
          0.50
        
        
          0.050
        
        
          0.050
        
        
          0.10
        
        
          0.10
        
        
          Swelling index κ
        
        
          0.02
        
        
          0.012
        
        
          0.012
        
        
          0.015
        
        
          0.015
        
        
          Critical state constant M
        
        
          1.45
        
        
          1.36
        
        
          1.36
        
        
          1.26
        
        
          1.26
        
        
          NCL intercept N
        
        
          (at


            p


          ’ = 98 kPa)
        
        
          4.3
        
        
          1.98
        
        
          1.98
        
        
          2.00
        
        
          2.00
        
        
          Poisson’s ratio ν
        
        
          0.1
        
        
          0.1
        
        
          0.1
        
        
          0.3
        
        
          0.3
        
        
          <Evolution parameters>
        
        
          Degradation parameter
        
        
          of structure


            a


          0.8
        
        
          2.2
        
        
          2.2
        
        
          0.8
        
        
          0.8
        
        
          Degradation parameter
        
        
          of structures


            b


          and


            c


          1.0
        
        
          2.0
        
        
          1.0
        
        
          1.0
        
        
          1.0
        
        
          1.0
        
        
          1.0
        
        
          1.0
        
        
          1.0
        
        
          1.0
        
        
          Degradation parameter
        
        
          of overconsolidated state


            m


          5.0
        
        
          1.0
        
        
          1.0
        
        
          1.2
        
        
          1.2
        
        
          Evolution parameter


            b


            r


          0.001
        
        
          1.00
        
        
          1.00
        
        
          0.150
        
        
          0.150
        
        
          Limit of rotation


            m


            b


          1.0
        
        
          0.6
        
        
          0.6
        
        
          1.0
        
        
          1.0
        
        
          Permeability


            k


          (cm/sec)
        
        
          1.0
        
        
          -7
        
        
          4.0
        
        
          -3
        
        
          4.0
        
        
          -3
        
        
          1.0
        
        
          -7
        
        
          1.0
        
        
          -7
        
        
          Density ρ
        
        
          s
        
        
          (g/cm
        
        
          3
        
        
          )
        
        
          2.631
        
        
          2.631
        
        
          2.631
        
        
          2.65
        
        
          2.65
        
        
          <Initial conditions>
        
        
          Void ratio


            e


          3.87
        
        
          Overconsolidation ratio
        
        
          1/


            R


          0
        
        
          6.5
        
        
          17.0
        
        
          3.0
        
        
          2.0
        
        
          Degree of structure 1/


            R


          *
        
        
          0
        
        
          3.0
        
        
          2.5
        
        
          1.0
        
        
          1.7
        
        
          1.7
        
        
          Degree of anisotropy ζ
        
        
          0
        
        
          0.545
        
        
          0.545
        
        
          0.75
        
        
          0.545
        
        
          0.545
        
        
          Coefficient of lateral
        
        
          pressure


            K


          0
        
        
          0.6
        
        
          0.6
        
        
          0.5
        
        
          0.6
        
        
          0.6
        
        
          Table 2: Pile material properties
        
        
          Pile
        
        
          Elastic modulus E (kPa)
        
        
          47360000
        
        
          Poisson’s ratio ν
        
        
          0.2
        
        
          Density ρ (g/cm
        
        
          3
        
        
          )
        
        
          2.3
        
        
          Coefficient of lateral pressure


            K


          0
        
        
          0.0