 
          2773
        
        
          Technical Committee 212 /


            Comité technique 212


          0
        
        
          20
        
        
          40
        
        
          60
        
        
          80
        
        
          100
        
        
          0
        
        
          100
        
        
          200
        
        
          300
        
        
          400


            Displacement (mm)


            Time (min)


          Case1
        
        
          0.01
        
        
          mm/sec
        
        
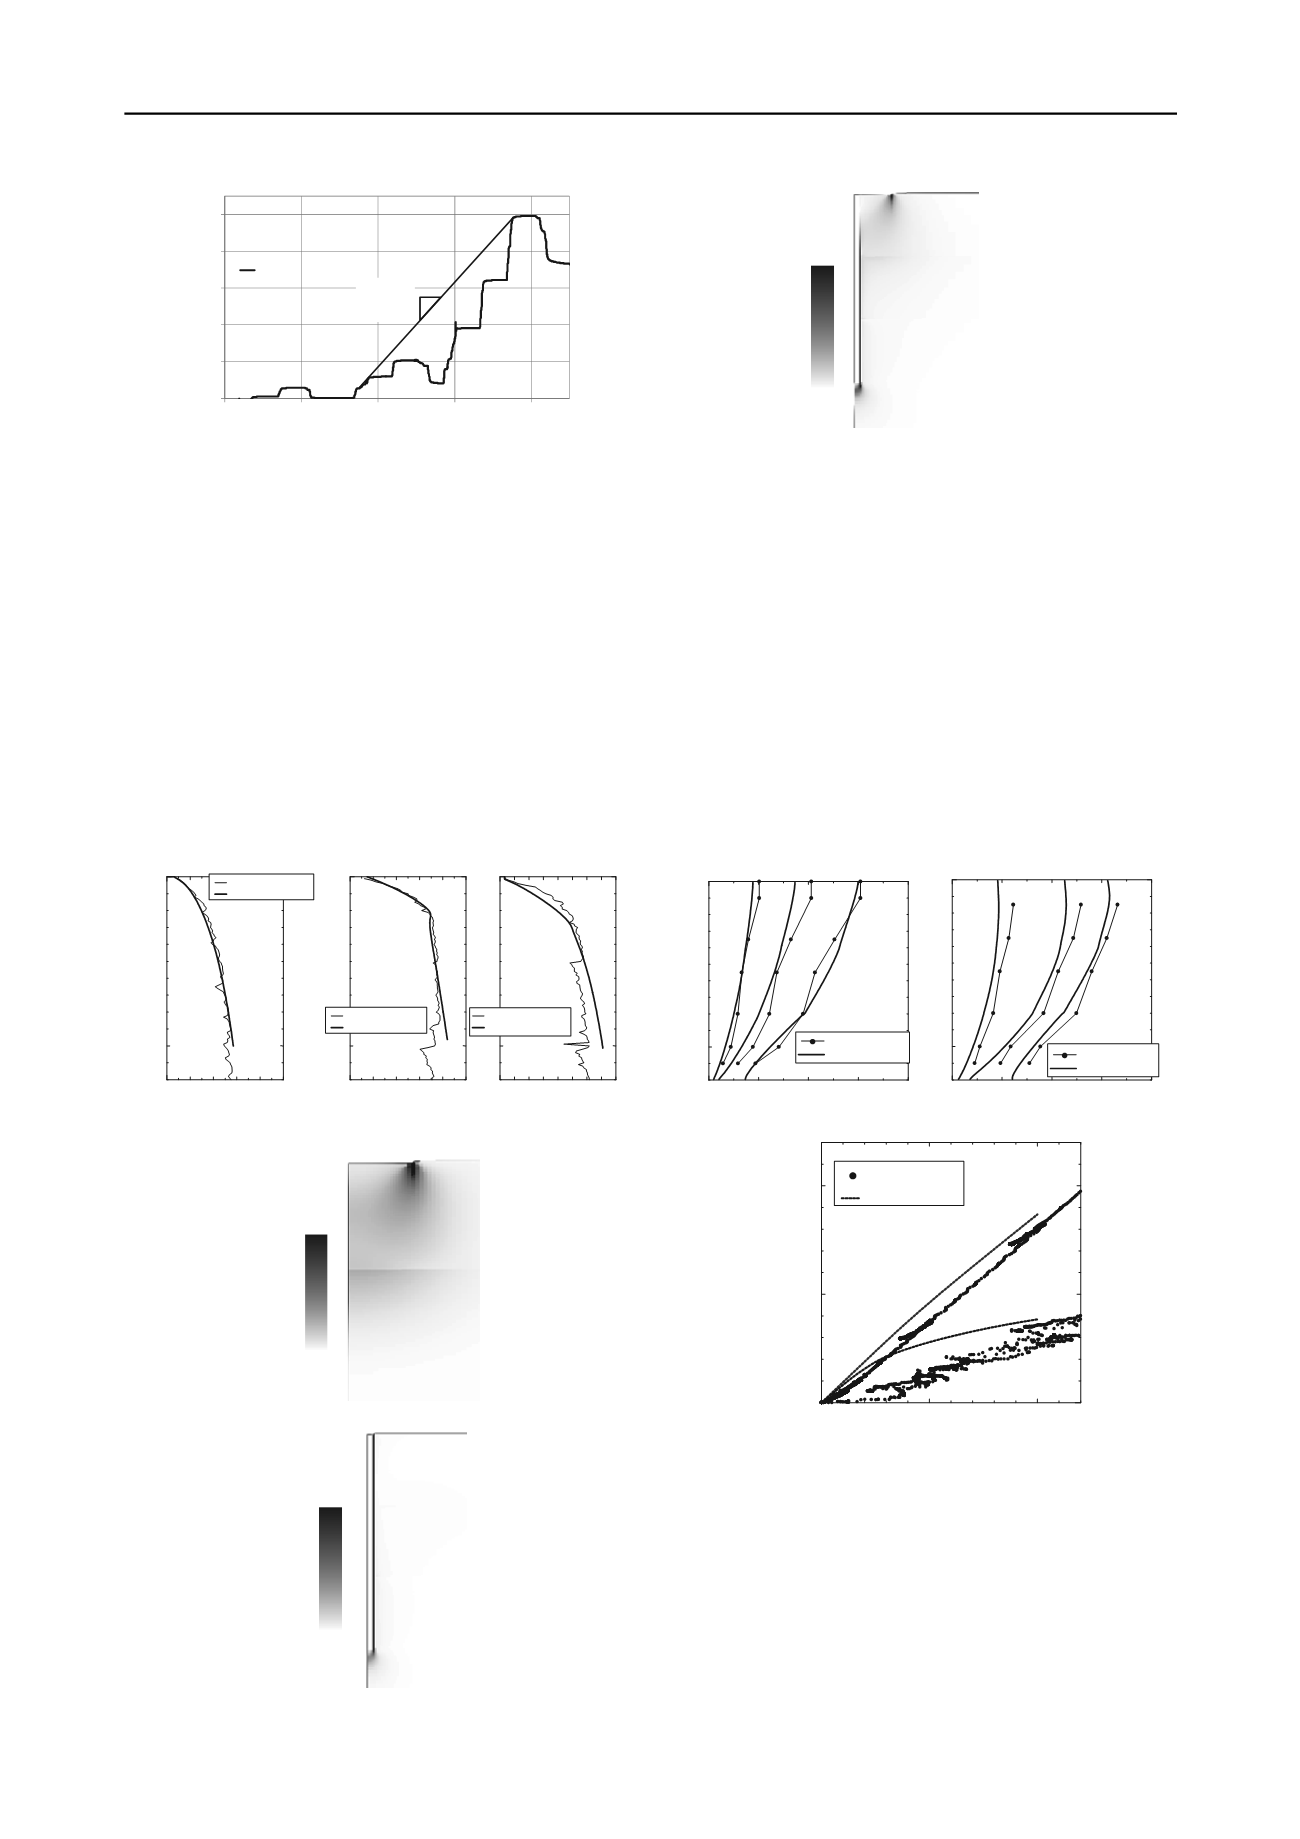
          Figure 5: Experimental displacement versus loading time
        
        
          4 COMPARISON OF EXPERIMENTS AND
        
        
          SIMULATIONS
        
        
          Figure 6 shows both the experimental and simulated results for
        
        
          the relationship between settlement and load at the center of the
        
        
          load area. It can be seen that the simulation reproduced the
        
        
          experimental results in each case, including the initial modulus
        
        
          and the inflection point for Case 2. Figure 7 shows the shear
        
        
          strain contours at a settlement of 10 cm. For Case 1, the
        
        
          distribution of shear strain under the raft appears wedge shaped.
        
        
          For Case 2, the shear strain around the pile is high because of
        
        
          friction between the soil and the pile. Shear stain is also high at
        
        
          the toe of the pile. For Case 3, although the shear strain under
        
        
          the raft and around the pile is also high, the strain around the
        
        
          upper part of the pile is not. This is because the friction around
        
        
          the upper part of the pile is not sufficient to deform the soil
        
        
          under the raft into a wedge shape.
        
        
          0
        
        
          2000
        
        
          4000
        
        
          100
        
        
          0
        
        
          Load
        
        
          (kN)
        
        
          Settlement (mm)
        
        
          Experimental data
        
        
          Simulation
        
        
          0
        
        
          2000
        
        
          4000
        
        
          100
        
        
          0
        
        
          Load
        
        
          (kN)
        
        
          Settlement (mm)
        
        
          Experimental data
        
        
          Simulation
        
        
          0 2000 4000 6000 8000
        
        
          100
        
        
          0
        
        
          Load
        
        
          (kN)
        
        
          Settlement (mm)
        
        
          Experimental data
        
        
          Simulation
        
        
          (a) Case 1                  (b) Case 2                 (c) Case 3
        
        
          Figure 6: Relationship between settlement and load
        
        
          0.0
        
        
          0.1
        
        
          (a) Raft
        
        
          0.0
        
        
          0.3
        
        
          (b) Pile
        
        
          0.0
        
        
          0.2
        
        
          (c) Piled raft
        
        
          Figure 7: Shear strain contours
        
        
          Figure 8 shows the axial force distribution for loads of 1,000,
        
        
          2,000, and 3,000 kN on the head of the pile. For Cases 1 and 2,
        
        
          the simulations reproduce the experimental results. For Case 3,
        
        
          no increase in axial force occurs from the soil surface to a depth
        
        
          of 2 m. As noted previously, this indicates that friction around
        
        
          the upper part of the pile is not effective in deforming the soil
        
        
          under the raft. Figure 9 shows the relationship between the
        
        
          vertical displacement at a soil depth of 1.0 m or 4.5 m and the
        
        
          raft settlement. The measurement point is shown in figure 1. It
        
        
          can be seen that there is good agreement between the
        
        
          experimental and simulation results. At a depth of 1.0 m, the
        
        
          displacement is almost the same as that at the surface, whereas
        
        
          at 4.5 m, it is consistently less. This is probably due to
        
        
          horizontal compression or deformation of the soil at a depth of
        
        
          4.5 m.
        
        
          0
        
        
          2000
        
        
          4000
        
        
          10
        
        
          0
        
        
          Axial Force (kN)
        
        
          Elevation (m)
        
        
          Experimental data
        
        
          Simulation
        
        
          1000 kPa 2000 kPa
        
        
          3000 kPa
        
        
          0
        
        
          2000
        
        
          4000
        
        
          10
        
        
          0
        
        
          Axial Force (kN)
        
        
          Elevation (m)
        
        
          Experimental data
        
        
          Simulation
        
        
          1000 kPa
        
        
          2000 kPa
        
        
          3000 kPa
        
        
          (a) Pile                              (b) Piled raft
        
        
          Figure 8: Axial force distribution
        
        
          5
        
        
          10
        
        
          0
        
        
          5
        
        
          10
        
        
          Raft settlement (cm)
        
        
          Vertical displacement in the ground (cm)
        
        
          Experimental data
        
        
          Simulation
        
        
          -4.5m
        
        
          -1.0m
        
        
          Figure 9: Relationship between vertical displacement at
        
        
          different depths and raft settlement
        
        
          5 COMBINED BEARING CAPACITY OF PILE AND
        
        
          RAFT
        
        
          Figure 10 shows the relationship between the settlement and
        
        
          load. Here, “Pile + raft (Exp.)” indicates the combined
        
        
          experimental load of the pile and the raft, “Piled raft (Exp.)”
        
        
          represents the experimental data for the piled raft foundation
        
        
          (Case 3) and “Pile + raft (Sim.)” shows the simulation results
        
        
          for the combined load of the pile and the raft. The simulation
        
        
          results for the piled raft foundation (Case 3) are omitted because