2781
Technical Committee 212 /
Comité technique 212
Figure 4 Observed maximum wall deflection and settlements for stiff
clays, residual soils and sands (Clough and O’Rourke, 1990)
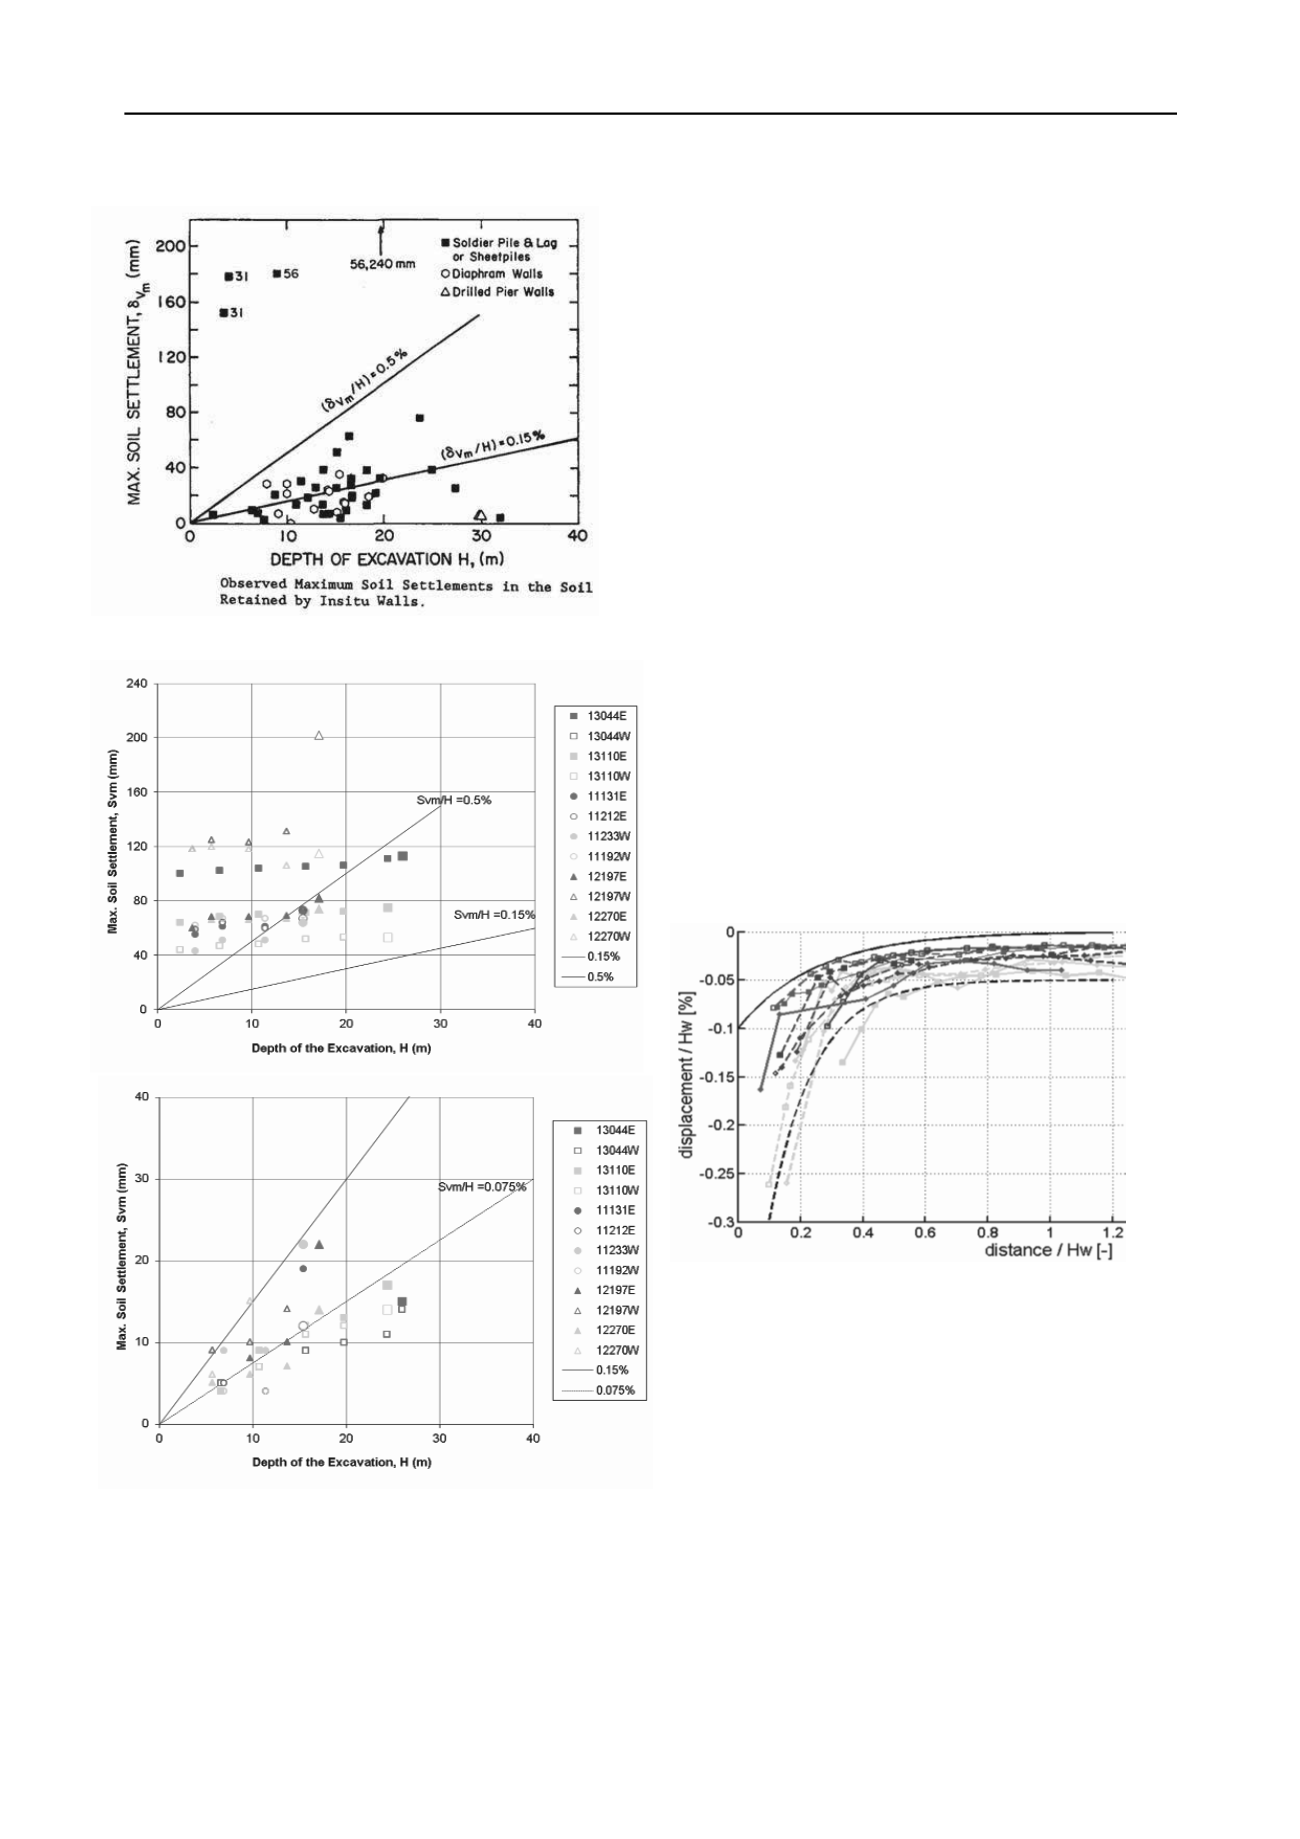
Figure 5 Observed Maximum surface settlements in Amsterdam for a) all
construction effects (including preliminary activities) and b) for
excavation only.
At the time of the end of the measurements presented here,
Figure 5(a) shows the surface settlement to fall within the band
of 0.15-0.5% times the excavation depth as determined by
Clough and O’Rourke (1990), except for 2 incident locations
(12197W and 12270W) as described in Korff et al. (2011).
During the early stages of construction, the surface settlement is
approximately 1% of the excavated depth. This can be attributed
to the significant impact of the preliminary activities, mainly
due to the presence of highly disturbed soil conditions. The final
values (shown slightly bigger in Figure 5(a)) for the surface
settlement average to 0.3 to 0.45% of the excavation depth, with
0.3% for Ceintuurbaan Station which had almost reached full
depth and 0.45% for Rokin and Vijzelgracht Station, which
were both excavated about halfway down. The additional
displacement due to the deeper excavation steps is small
compared to the preliminary activities.
If the preliminary stages are not taken into account, the
values are given in Figure 5(b) look much more like the values
found by Clough and O’Rourke. The surface settlement, due to
excavation of the stations, is less than 0.15% of the excavated
depth, with an average of 0.07%. This value was achieved
through the use of the very stiff diaphragm wall in combination
with a large number of struts, including the deep grout strut.
3 SHAPE OF THE SURFACE SETTLEMENT
The results of all three stations are combined in Figures 6 and 7.
During the preliminary activities (Figure 6) a hogging
displacement profile similar to that seen above tunnels fits the
measurements reasonably well. Most of the displacement in this
stage is caused by predrilling and raising of the ground level
close to the edge of the excavation, both having the largest
impact on the top layers, thus resulting in this curved profile.
During the excavation, shown in Figure 7, the shape of the
surface displacement consists of both hogging and sagging
parts. The sagging part could not always be captured, because
some settlement markers close to the excavation were lost in the
process of construction. The shape of the surface displacement
profile suggested by Hshieh and Ou (1998) fits the curves
reasonably well, although it sometimes extends further away
from the wall.
Figure 6 Measured surface displacements normalized with wall depth
Hw for Amsterdam stations during preliminary activities, with upper
bound (solid line) and lower bound (dashed line)
4 GROUND DISPLACEMENTS AT DEPTH
Especially for buildings with deep foundations, the
displacements at deeper levels in the ground are important.
Figure 8 shows the measurements of the vertical ground
displacement at the surface compared to the extensometer data
at two additional depths, NAP-12m and NAP-20m. At larger
excavation depths the influence zone is significantly smaller
than 2 times the excavation depth. The diagonal line from Aye
et al. (2006) can be used as an estimate for the influence area; it
is a conservative line. Also the curvature of the displacement
profiles associated with it can be considered conservative. For a
better fit, the maximum distance from the wall for significant
surface displacements (D0) could be taken as 2 times the
excavated depth, instead of 2.5 times as suggested by Aye et al.
(2006).


