2797
Technical Committee 212 /
Comité technique 212
rock socket of both test piles consisted of slightly weathered,
medium to high strength, Triassic aged sedimentary rock
(interbedded layers of mudstone, sandstone and siltstone).
In both TP1 and TP2 the shaft resistance of the section of
rock socket existing between the level of the installed Osterberg
Cell and pile tip was observed to have become fully mobilised
during the application of a peak load (up to 56.6MN,
approximately 3.1 times the expected SLS load).
The maximum shaft capacity of the 2.66m length of shaft
that existed below the installed Osterberg Cell of TP1 was
calculated to be 17.55MN, with a residual value of 16.4MN.
The residual value represented a 7% decrease from the
maximum observed value. Similarly, the peak shaft capacity of
the 5.24m length of TP2 between the Osterberg Cell and pile tip
was determined to be 29.2MN.
3 ROCK SOCKET DESIGN PROCEDURES
Early work for rock socket design occurred in Australia by
Williams, Johnston and Donald (1980) who examined non-
linear pile design in Melbourne Mudstones, and Rowe and Pells
(1980) who calibrated elastic pile design with Sydney
Sandstones and Shales. Horvath and Kenny (1979) undertook
similar field and laboratory testing on mudstones in Canada
while Meigh and Wolshi (1979) conducted comparable work in
Europe. Side slip design was subsequently detailed by Rowe
and Armitage (1987).
Kulhawy and Phoon (1993) showed the discontinuity in shaft
friction between clays and various soft rocks (shales, mudstones
and limestone). Seidel and Haberfield (1995) extended that
work to demonstrate that rock socket performance is highly
dependent on shaft roughness and socket diameter; whereby pile
shaft friction reduces as the pile diameter increases.
Generally, rock socket design is governed by serviceability
conditions rather than ultimate load conditions, and the load –
deformation behaviour of the rock sockets are determined
largely by the rockmass deformation properties. The rockmass
modulus (
Ε
m
) value can be estimated from the modulus of intact
rock (
Ε
i
) reduced for the frequency of rock defects. Relevant
theory is discussed by Zhang (2004).
Various pile rock socket design procedures are now available
which frequently calculate the design shaft capacity based on
correlation with a “characteristic” compressive rock strength
(
q
uc
) value. A good summary of the shaft shear capacity
equations derived by design method researcher is provided in
Kulhawy et al. (2005). Gannon et al. (1999) described four of
these methods and showed, even when adopting consistent rock
properties for design, the resulting design pile socket shear
capacities ranged widely. The longest pile socket lengths for the
example provided were predicted by the Carter and Kulhawy
(1988) design method, while the Rowe and Armitage (1987)
and Williams et al. (1980) procedures reduced the socket
lengths by 40-60%.
This paper aimed to provide guidance on two key questions:
o
Which rock socket design method should be used?
o
What characteristic rock strength value should be selected
(and does the selected method alter the required value)?
Ng et al. (2001) showed that the correlations presented by
Rowe and Armitage (1987) and Hovarth et al. (1983) are
applicable for sedimentary and volcanic rocks respectively.
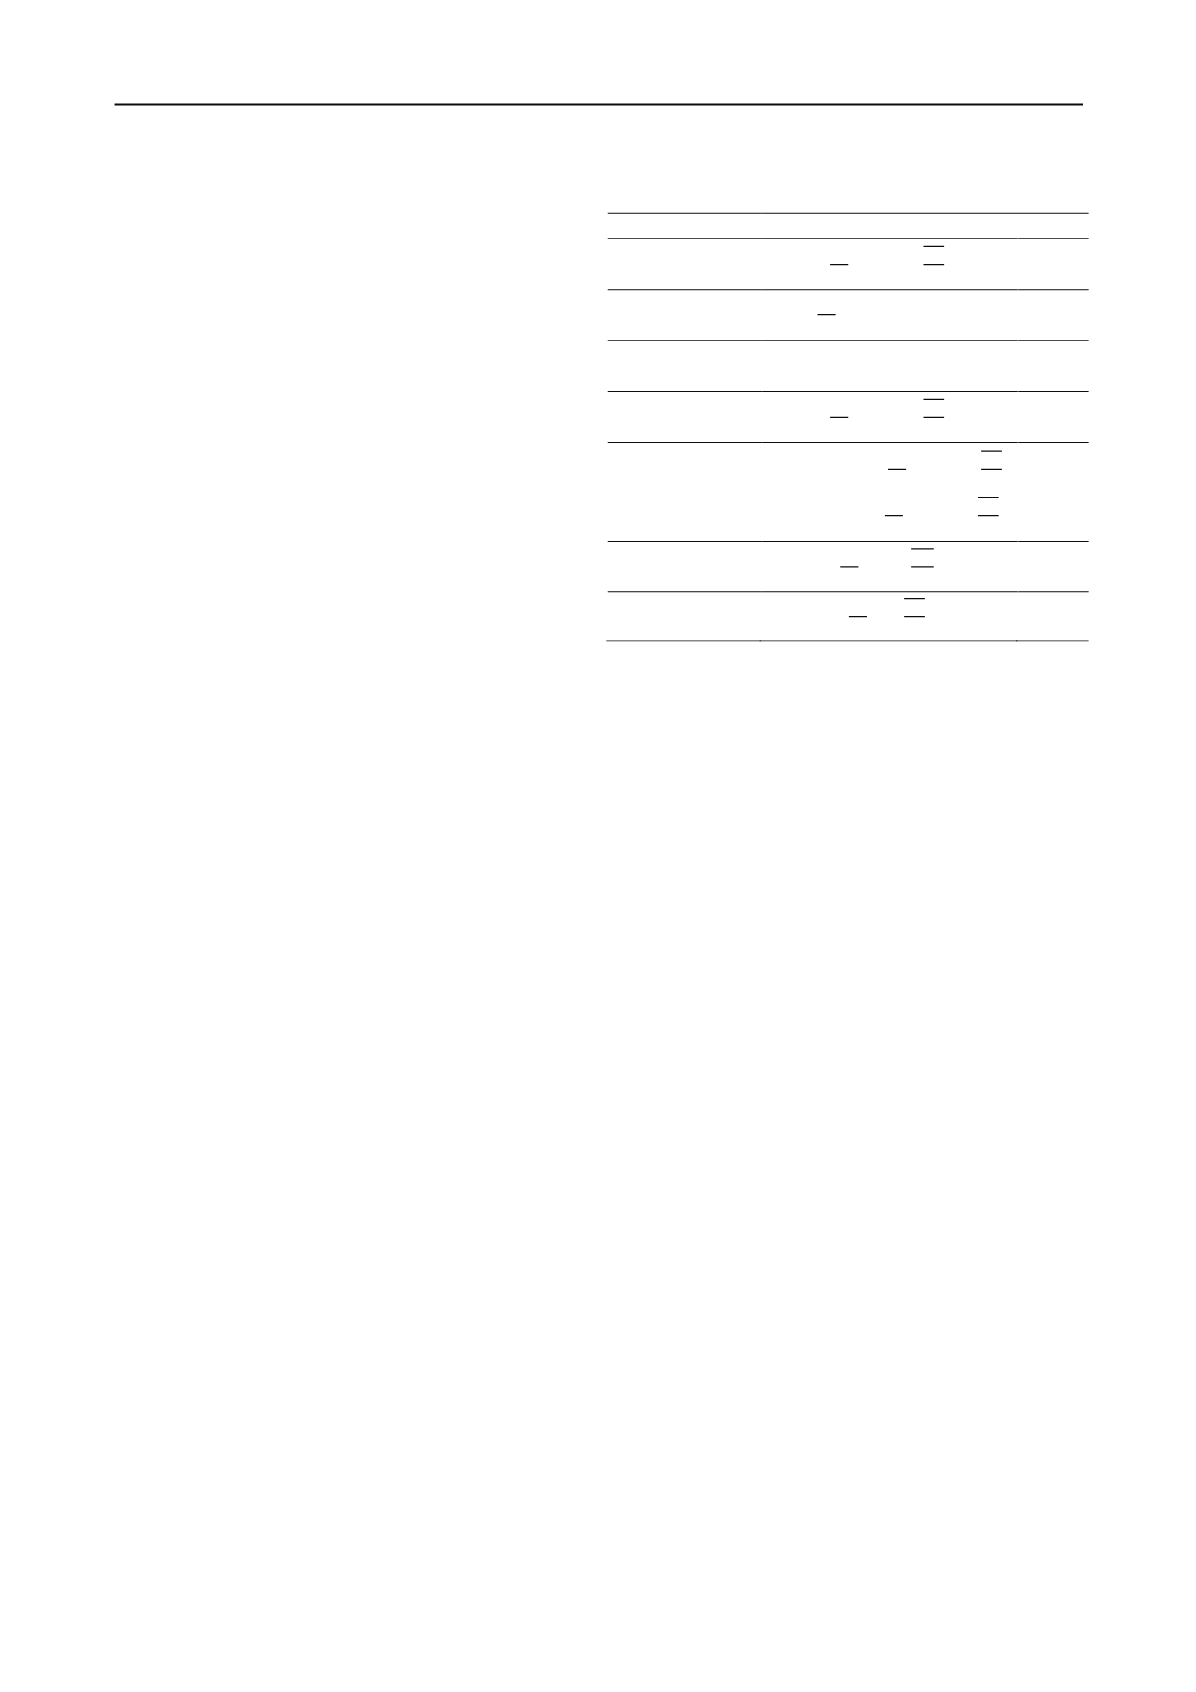
Table 3. Unit side resistance formulas for considered rock socket pile
design methodologies, normalised with atmospheric pressure (
)
Design Method
Normalised Unit Side Resistance Equation
Hovarth and Kenny
(1979)
*
= 0.65
(1)
Meigh and Wolski
(1979)
= 0.55(
)
.
(2)
Williams, Johnson
and Donald (1980)
= α(
)
(3)
Rowe and Armitage
(1987)
= 1.42
(4)
Carter and Kulhawy
(1988)
Lower Bound:
= 0.63
Upper Bound:
= 1.42
(5)
(6)
Kulhawy and Phoon
(1993)
=
(7)
Prakoso (2002)
=
(8)
*
Also confirmed by Zhang (1999) and Reese and O’Neill (1988)
3.1
Back-analysis of rock socket design methodologies
By using the measured ultimate shaft frictional capacity as the
basis for back-analysis, “characteristic”
q
uc
input values could
be determined for each considered rock socket design method.
Table 3 details the rock socket pile design methodologies
considered and the published formulae used in each to calculate
dimensionless unit side resistance values (
)
. These values are
transformed to rock socket design capacities via multiplication
of the calculated
value by the surface area of the segment of
the rock socket that was loaded to capacity. In this study it has
been assumed that the pile socket is effectively smooth and that
concrete strength does not limit the shear capacity of the pile.
No factors of safety have been applied as field data is being
fitted back to design equations.
Notes relevant to the formulae presented in Table 3 include:
o
Eq. (3) calculates shear capacity based on both the rock
strength value and a mass factor (
j
) which is defined as the
ratio of rock mass modulus to intact rock modulus. Based
on the average logged RQD values (TP1 = 70%; TP2 =
55%), a mass factor (
j
) of 0.33 would be appropriate for
TP1 (
j
= 0.20 for TP2). Also, in Eq. (3)
α
is directly related
to the adopted
q
uc
, whilst
β
is estimated from the
j
value.
o
Shaft capacity values for Eq. (4) are recommended to be
multiplied by a partial factor of 0.7 to ensure the probability
of exceeding design settlements is lower than 30%.
o
The coefficient C in Eq. (7) is based on conservatism and
rock socket roughness; C = 1 provides a lower bound
estimate, C = 2 for mean pile behaviour and C = 3 for upper
bound estimates or for rough rock sockets.
o
The approach used to derive Eq. (8) was cited by Kulhawy
et al. (2005) as providing the most consistent approach in
evaluation of the constructed pile load dataset.
3.2
Back-calculation Results
Table 4 provides a summary of the various input UCS values
required to achieve the ultimate shaft capacity values observed
in each test pile. These values have been back-calulated via use
of the equations detailed in Table 3. The 5
th
percentile closest to
the required UCS value has been determined for both the
normal and non-normal distribution functions fitted to each test
pile’s strength data (refer Table 2).


