2824
Proceedings of the 18
th
International Conference on Soil Mechanics and Geotechnical Engineering, Paris 2013
The results of three of the axial tests are summarized by
Abdelrazaq et al (2011). However, the as-built records for one
of the nominal 2.5 m diameter test piles, TP-03, indicated a
variation in verticality, concrete quality and pile shape. The as-
built records for TP-03 were reviewed ahead of the pile test, and
assessment was made of the the likely performance of the as-
built pile under the proposed pile test load sequence. The as-
built assessment was based on construction records for
excavation and concreting and the results of non-destructive
testing (Koden and sonic logging). These records facilitated an
assessment of the pile shape, verticality and concrete quality.
These characteristics were then used to assess the way in which
load is shed along the test pile.
Excavation of the pile hole to a depth of 34 m (within the
weathered soil) was carried out by reverse circulation drilling
(RCD) between 10 and 11 May 2010. Further advance of the
pile hole to the final depth of 47 m was carried out by RCD
after a 3 day interval between 15 and 18 May 2010.
2.2 Koden Survey and Pile Verticality
A Koden survey of the pile profile was carried out one day
after excavation of the pile hole had been completed by RCD.
The Koden results showed the following:
pile casing installed vertically with casing shoe located at a
depth of approximately 33 m (i.e. 14 m above the pile toe).
pile diameter variation in the range of 2.5 m to 3.2 m within
the weathered soil, weathered rock and soft rock.
pile profile inflection at an average depth of 37 m from near
vertical to 1(H):10(V).
socket profile over-break with short and long wavelength
variation of 0.4 m over approximately 4 m lengths and
superimposed shorter wavelength variation of 0.1 m to 0.2
m over 1 m lengths, respectively.
2.3 Pile Concreting Summary
Pile concreting was carried out on 22 May 2010 over a
period of approximately 12 hours (4 days after pile hole
excavation had been completed). A total of 282 m
3
of concrete
was used to fill the pile hole to a depth of 4 m from the surface.
The theoretical concrete volume for a pile of 2.35 m net
diameter and 47 m in length is 204 m
3
. It was therefore
assessed that an additional approximately 38% concrete volume
was used for pile TP-03. The pile temporary casing was lowered
to the pile toe and then raised in 7 stages of 5 m and 6 m lengths
depending on casing section length, with measurements of the
concrete level taken prior to and after extraction of each section
of casing. Small changes in concrete level were noted during
extraction of the first two lengths of casing, indicating a
difference between theoretical and measured concrete volume
of approximately 3 to 6 m
3
. This reflected a deficit of about 10-
20% as compared with the Koden over-break measurements and
it was considered that water entrapment may have occurred as
the casing was lowered to the base of the pile at the start of
concreting; therefore the pile socket bond could have been
affected.
A large drop in concrete level (approximately 6.5 m) was
measured as a result of extracting the third length of casing.
This represented a significant over-break within the depth range
31.5 m to 36.5 m. The summary chart of concreting works
indicated that the tip of the tremie tube was located 2 m below
the “fallen” concrete level. Further drops in concrete level in the
range of 1.5 m to 3 m were measured for the extraction of the
remaining four sections of casing.
The measured differences in concrete level for each casing
extracted are summarized in Table 1. These measurements
indicated a variation in the diameter of the pile with depth.
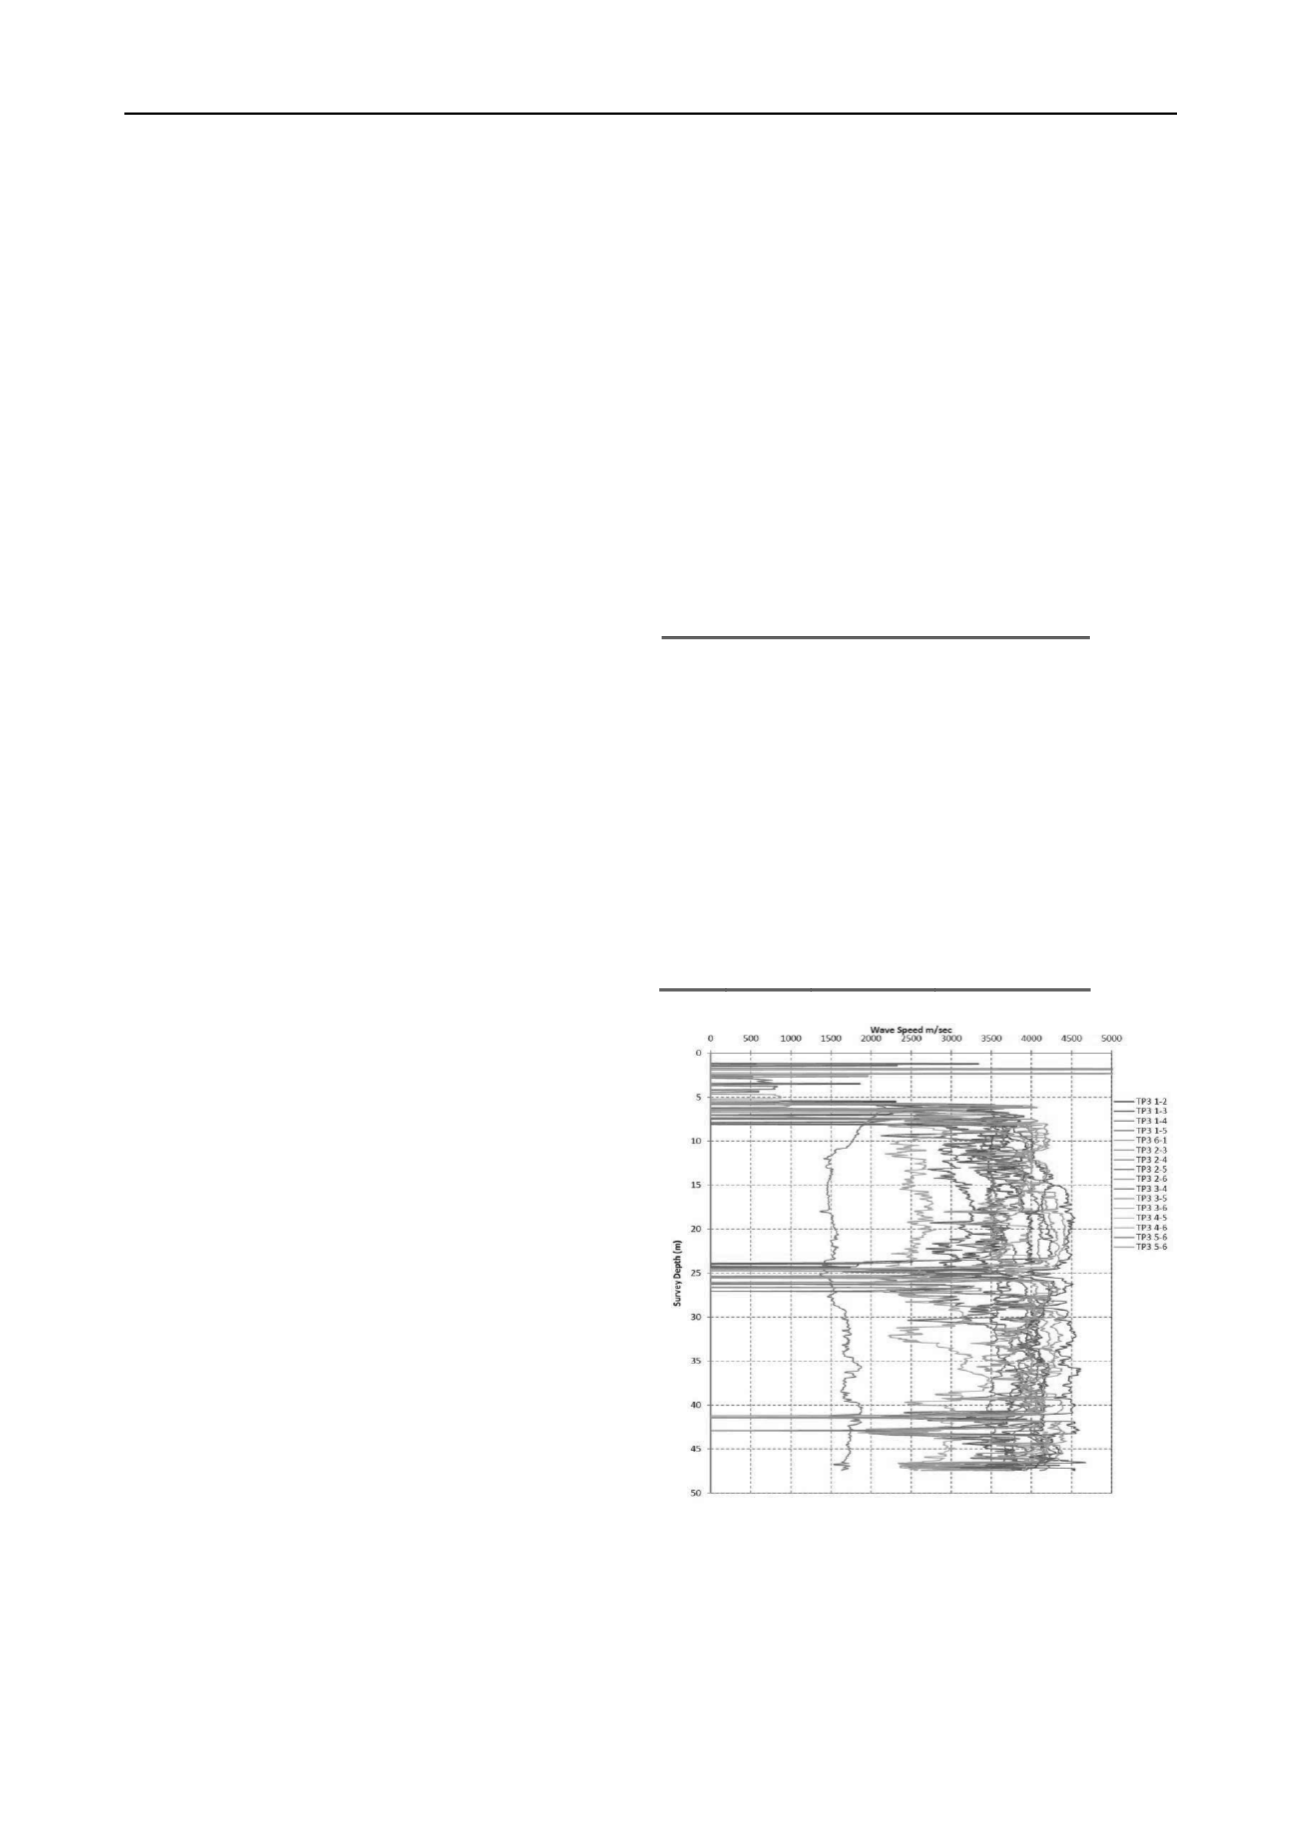
2.4 Sonic Logging Survey
A sonic logging survey was carried out for TP-03 on 28 May
2010, 6 days after concreting of the pile was completed. An
assessment of the survey results could not be carried out using
the standard sonic report sheets as poor correlation was
observed with apparent changes in wave velocity (“artefacts”)
associated with subsequent observations of irregular pipe
spacing, poor pipe verticality and possible de-bonding. The
summary wave trace files were therefore obtained from the
testing sub-contractor and are summarized in Figure 2, which
indicates the large range in wave speed measured and variation
thereof over short and long depth intervals.
An iterative process was adopted to exclude the artefact
effects mentioned above from the measured wave velocities,
and the results were resolved to provide sonic tomography
representations of the concrete quality along the piles length in
two sections at right angles to one another. The adjusted sonic
tomography plots showing variation along the pile length are
shown in Figure 3.
Table 1. Summary of as-built concreting records
Casing Depth
Range (m)
Casing
Length (m)
Concrete Level
Drop (m)
9
14
5
2.0
14
19
5
3.0
19
24
5
2.0
24
29
5
2.0
29
35
6
6.5
35
41
6
1.0
41
47
6
0.5
Figure 2 Measured wave speed versus depth along pile
Figure 3 indicates that poor concrete quality (shown as the
darker zones) is restricted to discrete levels with abrupt and
pervasive boundaries. The concrete quality was also found to
vary across the pile cross section. The information so derived
was processed to estimate the percentage of good quality
concrete within various depth ranges, as summarized in Table 2
below.


