2588
Proceedings of the 18
th
International Conference on Soil Mechanics and Geotechnical Engineering, Paris 2013
3D (100% )
3D (67%)
2D_Block
2D_Strip (100%)
2D_Strip (67%)
2D_Strip (80%)
equivalent properties,
φ
block
, c
block
and E
block
derived based on
the semi-empirical relationships given by Madhav, 1996.
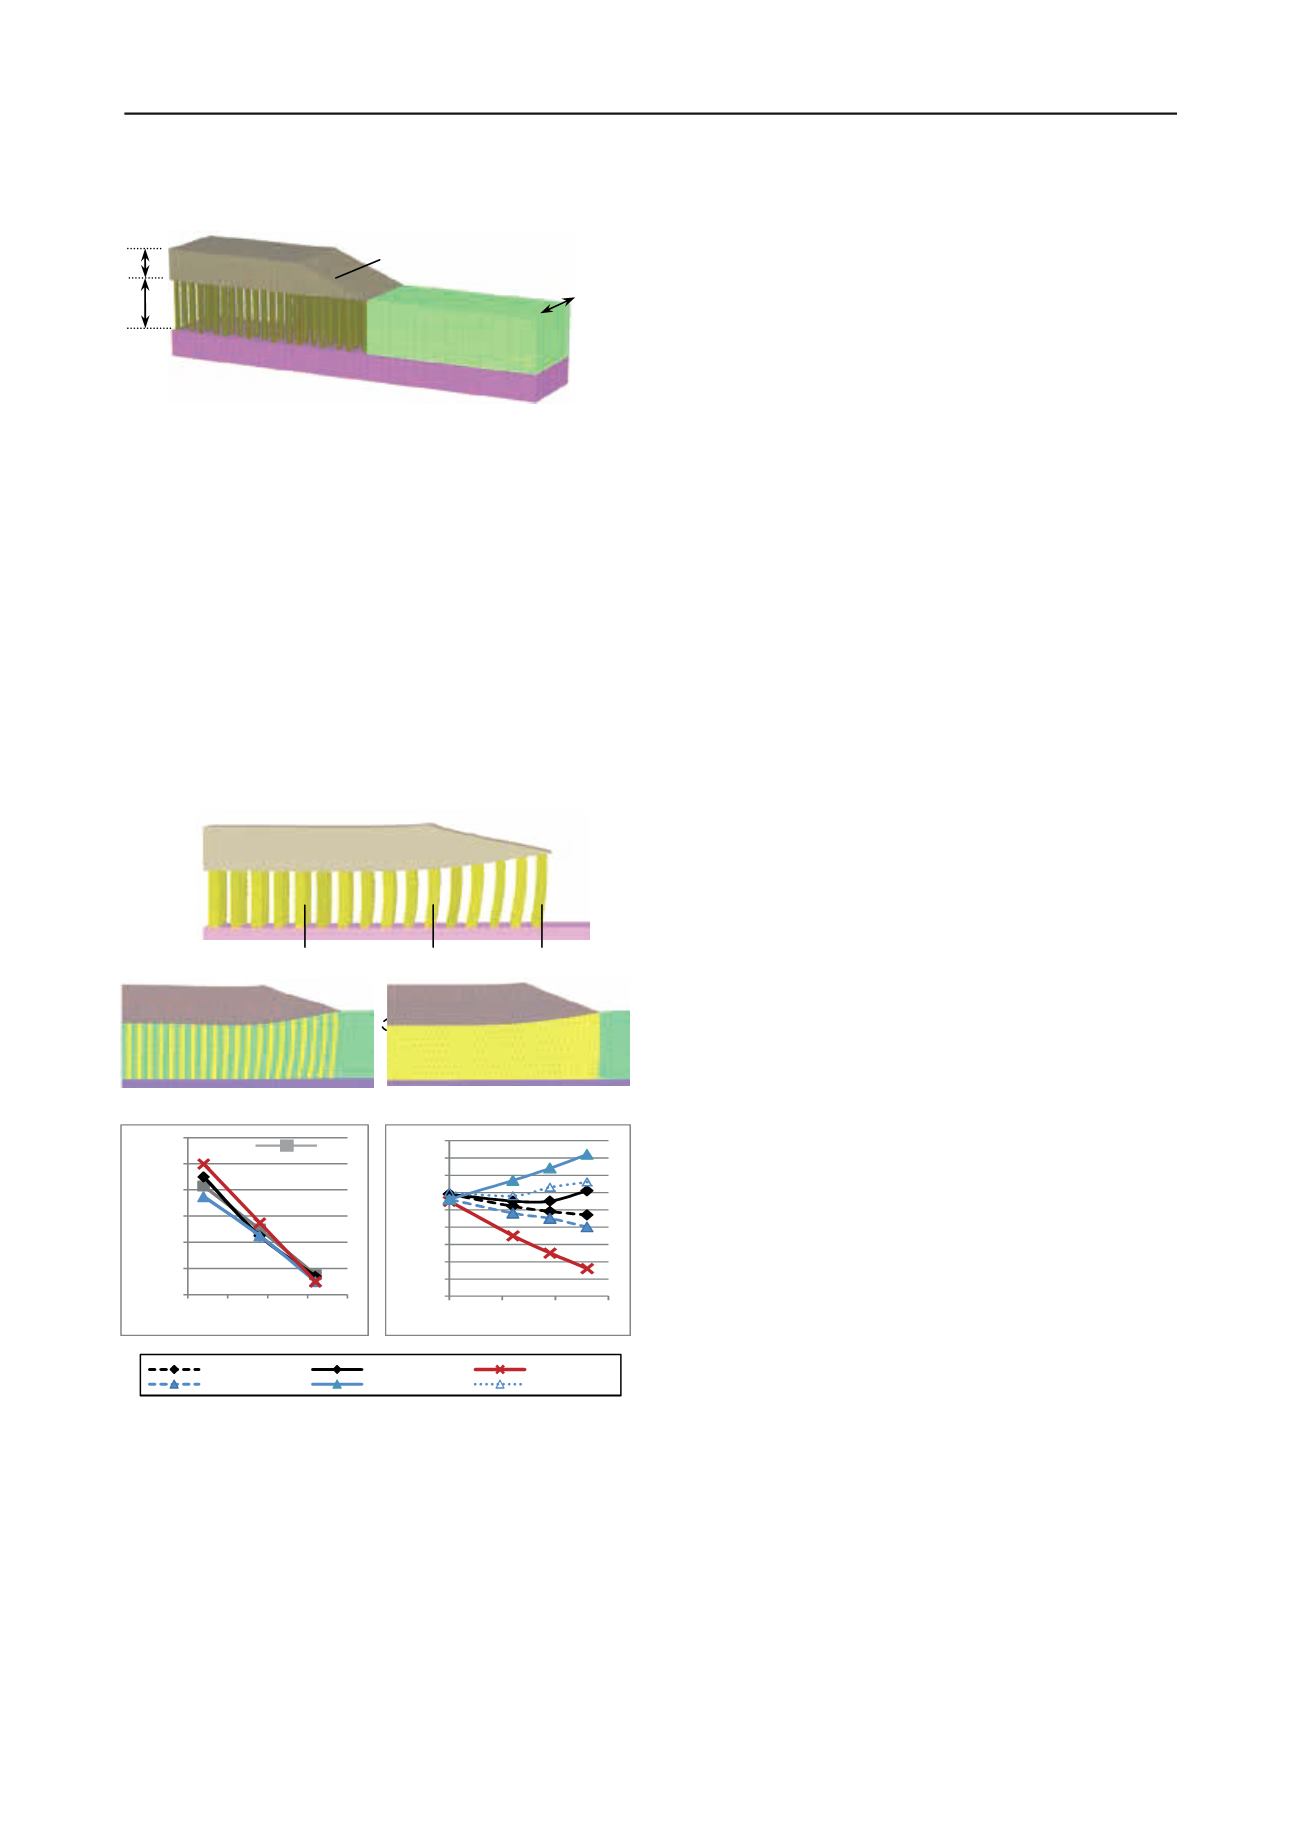
Figure 8. 3D FEA mesh
The baseline 3D model (Analysis 1) and the 2D strip model
(Analysis 3) show similar deformation mechanisms of the stone
columns, which can be broadly divided into three zones (see Fig
9a, 9b): Zone 1 away from the fill batter where columns
underwent vertical deformation by “bulging”; Zone 2 just
behind the crest of the fill batter where columns underwent both
vertical and horizontal deformation by “bulging” and “leaning”;
and Zone 3 beneath the fill batter where columns underwent
mainly leaning. This numerical prediction of the deformation
appears to be consistent with the results of the centrifuge model
test carried out by Stewart and Fahey (1994). The maximum
settlement of the embankment occurs in Zone 2 just before the
crest of the fill batter (more than that in Zone 1). This is
presumably due to the concurrence of bulging and leaning
deformation mechanisms of the stone columns. Conversely, the
columns in Zone 3 exhibit the maximum horizontal
displacement and are likely due to the prevailing leaning
deformation of the stone columns.
Figure 9. Comparison of FEA results
Figure 9c presents the deformation predicted by the
conventional 2D FEA using composite block material (Analysis
4). This method is unable to capture the bulging and leaning
deformation of the stone columns. The maximum settlement
occurs at the centre of the embankment (i.e. in Zone 1) as
opposed to in Zone 2 as predicted by the baseline 3D FEA and
the proposed 2D FEA using equivalent strips.
Figure 9d shows a plot of predicted settlements at points P
versus area replacement ratio
a
r
. All analyses give comparable
results, indicating that all the different FE methods are
commensurable in terms of settlement prediction under axially
symmetric load condition.
Figure 9e presents the predicted horizontal displacement at
point Q. The following points are drawn from the results:
•
hen original soil strengths are used for the interface
properties, the result of the 2D strip model (curve 1) compares
well with that of the 3D baseline model (curve 2). Both results
show a trend of reducing horizontal displacement with
a
r
.
•
hen the interface strength of the columns in the 3D model are
reduced to 67% of the soil strengths, the result (curve 3)
indicates an initial drop off in horizontal displacement with
a
r
,
but increases again once
a
r
> 20%. This is due to increasing
proportion of yielding elements in the remolded soil as the
columns draw closer to each other.
•
he application of the same interface strength reduction (67%
of surrounding soil strength) in the 2D equivalent strip model
has caused excessive yield in the remolded soil and led to
increased horizontal displacement with
a
r
(curve 4). A better
fit to the 3D solution is by changing the interface strength to
80% of the surrounding soil strength (curve 5). Evidently,
there needs a regime to determine an equivalent interface
strength for the strip model. This merits further research.
•
he 2D block model result (curve 6) under-predicts the
horizontal displacement when compared with the 3D baseline
model predictions. This indicates that the use of isotropic soil
properties in the 2D block model, which were derived based
on semi-empirical relationships originally for settlement
prediction under axially loading condition, have
overestimated the reduction in lateral spreading underneath
the embankment batter. The use of equivalent strips in the 2D
strip model is able to capture the interaction between the soil
and the stone column, leading to a better agreement for the
lateral deformation with the 3D baseline solution.
5 CONCLUSIONS
This paper presents a 2D FEA approach for analysing the
response of stone columns under embankment loading. The
stone columns are modeled as equivalent strips with the c
eq
and
E
eq
of the strips calculated based on weighted average area
approach, and the
φ
eq
derived based on force equilibrium
method, which requires a presumption of stress concentration
ratio of the stone column. For convenience, charts to assess the
stress concentration ratio have been generated for full depth and
floating stone columns. The solutions cover key parameters
including load levels, column spacing ratio, E
column
/E
soil
ratio
E
base
/E
column
ratio, E
base
/E
soil
ratio and column friction angles.
The accuracy of the proposed 2D strip model has been
investigated by comparing the results of the 3D baseline FEA
and the conventional composite approach. It has been shown
that the proposed strip model is preferable over the conventional
approach for the prediction of horizontal displacement.
However, further research is needed to develop a regime to
determine equivalent interface strength in the 2D strip method.
6 REFERENCES
Balaam, N.P. and Poulos, H.G. 1982. The behavior of foundations
supported by clay stabilized by stone columns.
Proc. 8th European
Conf. on Soil Mechanics and Foundation Engineering, Helsinki
.
FHWA. 1983. U.S. Department of Transportation Federal Highway
Administration (Dec, 1983) –
Design and Construction of Stone
Columns
, Vol 1. Report No. FHWA/RD-83/026.
Madhav,M.R. and Nagpure,D.D. 1996. Design of granular piles for
embankments on soft ground. Proc. 12th SE Asian Geot.Conf.,
Kaula Lumpur. 1: 285-290
Stewart, D.P. and Fahey, M. (1994). Centrifuge modelling of a stone
column foundation system, Seminar on ground improvement
techniques , Perth, Curtin Printing Services, 1: pp 101-111.
6m
10m
Soft Soil without
treatment
Embankment with 2H:1V batter
~13m
Zone 1
Zone 2
Zone 3
Bulging Bulging & Leaning
Leaning
P
Q
(a) 3D FEA (Baseline Analysis 1) with cylindrical stone columns
(b) 2D FEA (Analysis 3) with
equivalent stone column strips
(c) 2D FEA (Analysis 4) with
equivalent composite block
Max vert.
disp.
Max vert. disp.
(e) Hori. Disp.at Point Q
(d) Settlement at Point P
1
2
3
4
5
6
Axi-symmetric
20
30
40
50
60
70
80
90
100
110
0
10 20 30
Hori. displ. (mm) at point Q
Area replacement ratio a
r
150
170
190
210
230
250
270
10 15 20 25 30
Settlement (mm) at point P
Area replacement ratio a
r


