2579
Technical Committee 211 /
Comité technique 211
u
v0
ln s 0.64 ln OCR ln
0.874 0.237U
1
(4)
where 0.237 is the standard deviation of the transformation
uncertainty, and U
1
is standard normal. The third step is to
simulate N
60
and q
T
-
v
using the s
u
sample:
60
u
v0
2
ln N 1.633ln s 0.403ln
3.845 0.456U
(5a)
T v
u
ln q
ln s 2.54 0.34U
3
(5b)
where 0.456 and 0.34 are the standard deviations of the
transformation uncertainties, and U
2
and U
3
are standard
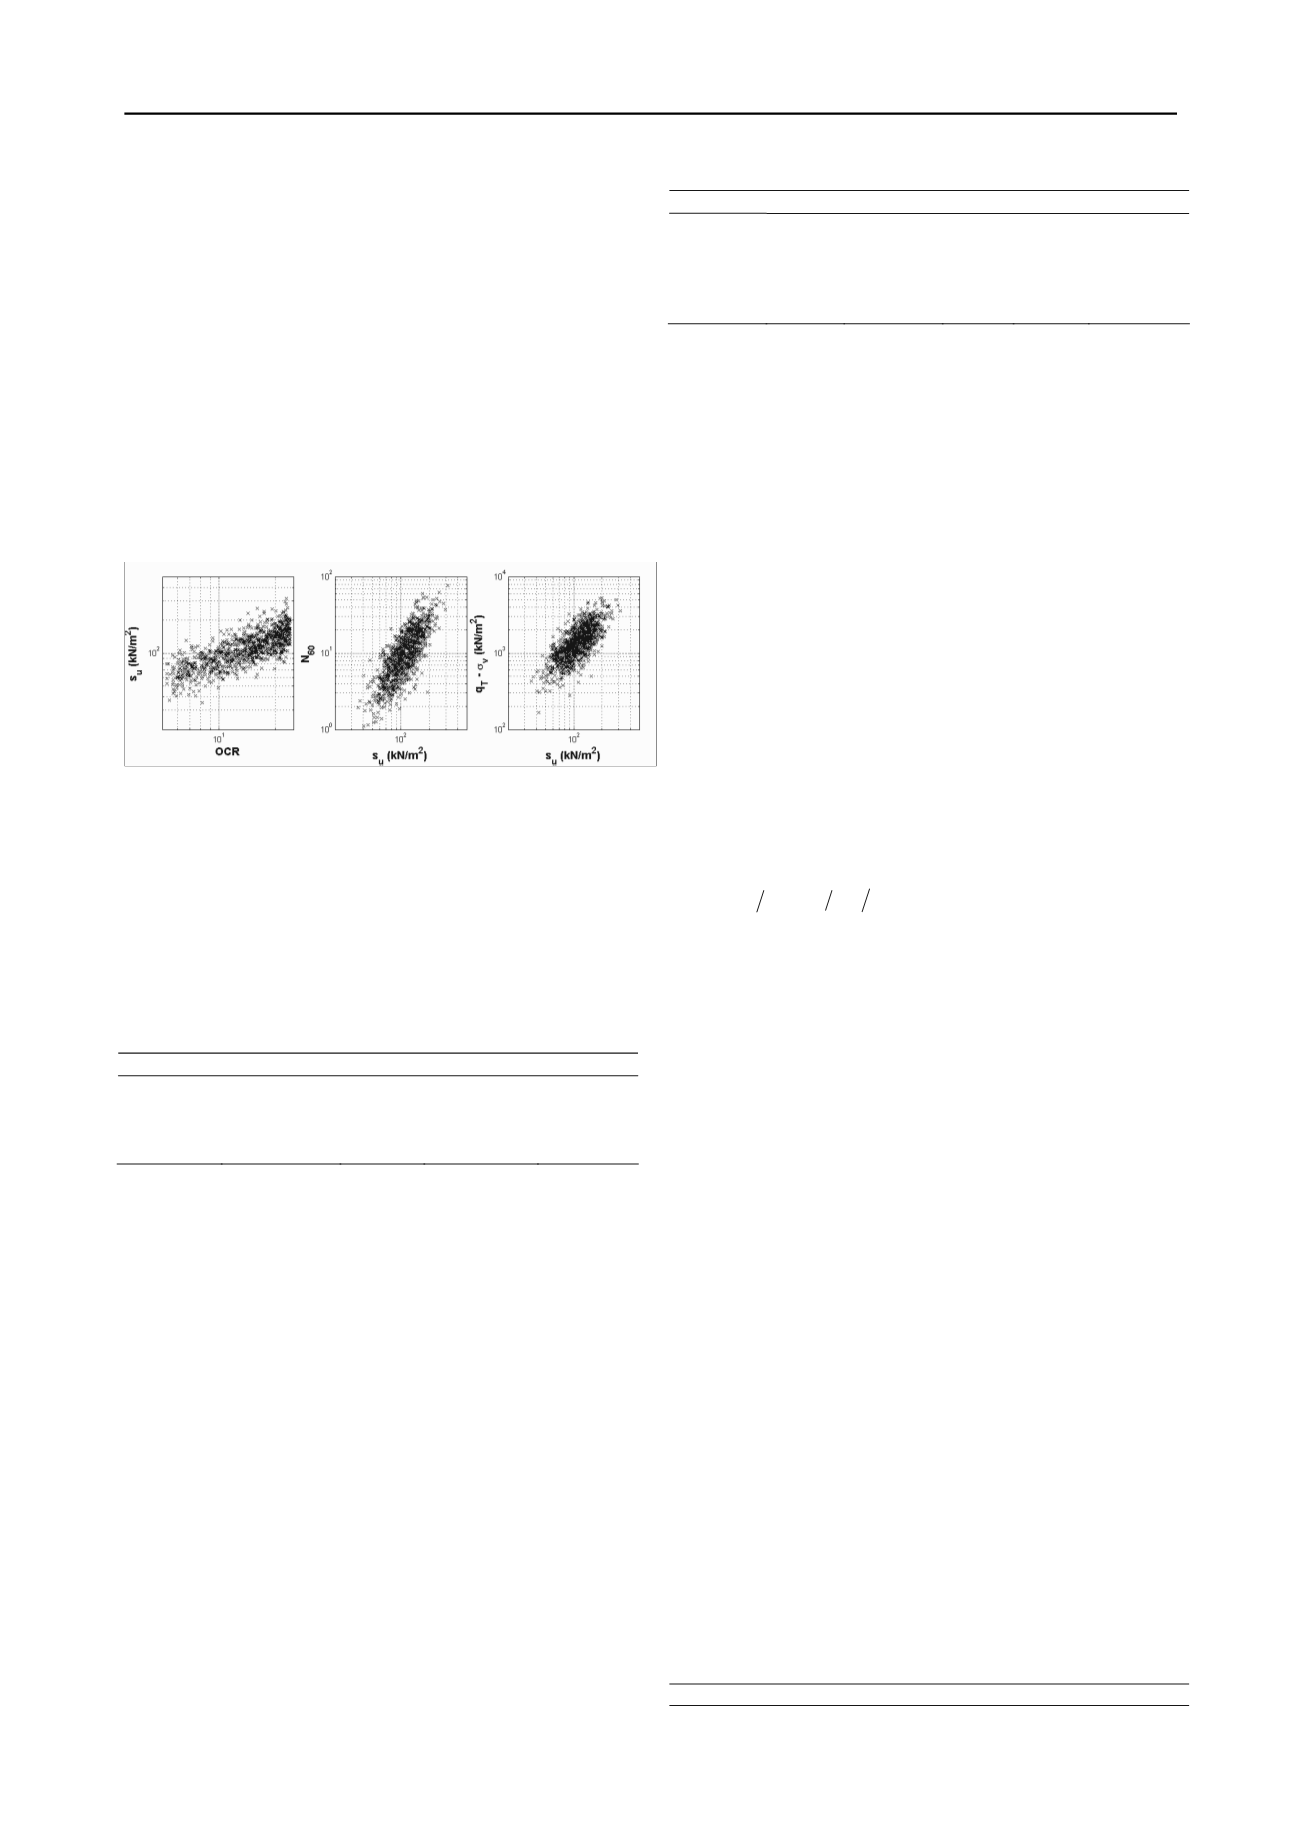
normal. Figure 2 shows the correlation plots for the simulated
{OCR, s
u
, N
60
, q
T
-
v
} for a case where OCR is uniformly
distributed over [5, 24].
Figure 2. Correlation plots for {OCR, s
u
, N
60
, q
T
-
v
} samples.
Based on the results of Ching et al. (2010), Phoon et al.
(2012) further assumed OCR to be lognormal with a reasonable
COV = 0.25. Under this assumption, they showed that the
underlying standard normal variables (X
1
, X
2
, X
3
, X
4
)
have the
correlation matrix shown in Table 3. The correlation matrix in
Table 3 should be suitable for unstructured clays covering a
fairly wide range of OCR.
Table 3. Correlation matrix C for (X
1
, X
2
, X
3
, X
4
)
for the four
selected parameters of unstructured clays (Source: Phoon et al.
2012).
X
1
(OCR)
X
2
(s
u
)
X
3
(q
T
-
v
)
X
4
(N
60
)
X
1
(OCR)
1.000
0.554
0.355
0.395
X
2
(s
u
)
0.554
1.000
0.642
0.714
X
3
(q
T
-
v
)
0.355
0.642
1.000
0.458
X
4
(N
60
)
0.395
0.714
0.458
1.000
2.3
Incomplete multivariate information (clean sands)
Ching et al. (2012b) presented a study that is very similar to
Ching et al. (2010) but for clean sands. The study was based on
a database containing five selected parameters of normally
consolidated clean sands: Y
1
=
cv
(critical state friction angle),
Y
2
= I
R
(dilatancy index, see Bolton 1986), Y
3
=
p
(peak secant
friction angle), Y
4
= (q
c
/P
a
)/(
’
v
/P
a
)
0.5
= q
c1
(corrected cone
resistance), and Y
5
= (N
1
)
60
(SPT N corrected for energy
efficiency and overburden stress). They considered Y
1
=
cv
and Y
2
= I
R
as given numbers and the remaining soil parameters
(Y
3
, Y
4
, Y
5
)
are random variables: Y
3
is normal, while Y
4
and
Y
5
are lognormal. Hence, Y
3
=
p
=
3
+
3
V
3
X
3
, ln(Y
4
) =
ln(q
c1
) =
4
+
4
X
4
, and ln(Y
5
) = ln[(N
1
)
60
] =
5
+
5
X
5
, in which
X
i
are standard normal random variables. If we further assume
cv
and I
R
are normal with reasonable standard deviations of 3
o
and 1
o
, respectively, i.e., Y
1
=
cv
=
1
+ 3X
1
and Y
2
= I
R
=
2
+
X
2
, and also assume independence between
cv
and I
R
, it can be
shown that the underlying standard normal variables (X
1
, X
2
,
X
3
, X
4
, X
5
)
has the correlation matrix shown in Table 4. The
correlation matrix in Table 4 should be suitable for normally
consolidated clean sands.
Table 4. Correlation matrix C for (X
1
, X
2
, X
3
, X
4
, X
5
)
for the
five selected parameters of clean sands (Source: Ching et al.
2012b).
X
1
(
cv
)
X
2
(I
R
)
X
3
(
p
) X
4
(q
c1
) X
5
[(N
1
)
60
]
X
1
(
cv
)
1.000
0.000
0.642
0.491
0.536
X
2
(I
R
)
0.000
1.000
0.642
0.491
0.536
X
3
(
p
)
0.642
0.642
1.000
0.764
0.835
X
4
(q
c1
)
0.491
0.491
0.764
1.000
0.638
X
5
[(N
1
)
60
]
0.536
0.536
0.835
0.638
1.000
2.4
Undrained shear strengths under various test procedures
The undrained shear strength (s
u
) of a clay is not a constant. In
particular, s
u
of a clay evaluated by different test procedures are
different because these tests may have different stress states,
stress histories, degrees of sampling disturbance, and strain
rates. Ching & Phoon (2013) constructs the multivariate normal
distribution of the s
u
values from seven s
u
tests (CIUC, CK
0
UC,
CK
0
UE, DSS, VST, UU, UC) based on a large clay database
consisting data points from 146 studies. Many s
u
data points are
associated with a known test mode (6310 points), a known OCR
(4584 points), and a known plasticity index (PI) (4541 points).
The geographical regions cover Australia, Austria, Brazil,
Canada, China, England, Finland, France, Germany, Hong
Kong, Iraq, Italy, Japan, Korea, Malaysia, Mexico, New
Zealand, Norway, Northern Ireland, Poland, Singapore, South
African, Spain, Sweden, Thailand, Taiwan, United Kingdom,
United States, and Venezuela. The clay properties cover a wide
range of OCR (mostly 1~10, few studies OCR > 10, but nearly
all studies are with OCR < 50) and a wide range of sensitivity S
t
(sites with S
t
= 1~ tens or hundreds are fairly typical).
An important step for the construction of the multivariate
distribution is to convert all s
u
data points in the database into
the following standardized form:
u,NC,1%,PI20 v
u v
OCR rate PI
s
σ = s σ b c d
(6)
where s
u,NC,1%,P20
is the undrained shear strength of a NC clay
with PI = 20 subjected to a 1% per hour strain rate; b
OCR
, c
rate
,
and d
PI
are modifier factors that adjust the reference normalized
undrained shear strength for overconsolidation ratio, strain rate,
and plasticity. Table 5 shows these factors (Ching et al. 2013;
Ching & Phoon 2013). The standardized s
u,NC,1%,P20
/
’
v
is be
denoted by Y
test mode index
. The test mode indices are respectively
1, 2, 3, 4, 5, 6, and 7 for CIUC, CAUC, CAUE, DSS, FV (field
vane), UU, and UC. Hence, there are seven random variables
(Y
1
, Y
2
Y
7
)
. Table 6 shows the statistics of Y
i
. The Y data
points for each test mode are roughly lognormally distributed,
i.e., X
i
= [ln(Y
i
)-
i
]/
i
is roughly standard normal. Given a test
mode i, the scatter in the Y
i
data points, quantified by the COV
in Table 6, may be due to measurement errors in s
u
and global
inherent variability in s
u
(s
u
from different geographic locales)
as well as the transformation uncertainties associated with the
standardization steps for PI, strain rate, and OCR.
The Y
i
data points are converted to standard normal
variables X
i
= [ln(Y
i
)-
i
]/
i
. Table 7 shows the correlation
matrix C for (X
1
, X
2
, …, X
7
)
. The estimated correlation
coefficients
ij
are quite sensible. The four triaxial compression
(TC) test modes (X
1
, X
2
, X
6
, X
7
)
seem mutually highly
correlated (
ij
> 0.8), with the exception of (X
6
, X
7
) having
ij
=
0.59. The CAUE test mode (X
3
) has weak correlation with TC
test modes (
ij
< 0.5), probably because it imposes a different
stress state from TC tests. The correlation coefficients between
FV and TC are relatively weak as well (
ij
0.63). Such
relatively low correlation between FV and TC may be due to the
fact that the FV test has several distinct aspects (stress state,
drainage boundaries, strain rate, and failure mode). It is
interesting that the correlation between FV and DSS is high (
ij
= 0.73).
Table 5 b
OCR
, c
rate
, and d
PI
factors (Source: Ching et al. 2013).
Factor
Test type
Formula
CIUC
OCR
0.602
b
OCR
CAUC
OCR
0.681


