2575
Technical Committee 211 /
Comité technique 211
0
50
100
150
200
250
300
0
10
20
30
40
50
60
70
Settlement (mm)
Time (Days)
Fieldmeasurements(Dharetal.2011)
Numericalpredictions(PointG1)
(K
h
/K
s
=2 & r
s
/r
m
=3)
Ū
=90%
0
50
100
150
200
250
300
0
20
40
60
80
100
Settlement (mm)
Time(Days)
Kh/Ks=2
Kh/Ks=3
Kh/Ks=4
Kh/Ks=5
r
s
/r
m
=2
Ū
= 90%
t = 34.0
t = 41.0
t = 47.5
t = 53.0
(a)
0
50
100
150
200
250
300
0
20
40
60
80
100
Settlement (mm)
Time(Days)
Kh/Ks=2
Kh/Ks=3
Kh/Ks=4
Kh/Ks=5
r
s
/r
m
=3
Ū
= 90%
t = 35.0
t = 42.0
t = 48.0
t = 57.0
(b)
0
50
100
150
200
250
300
0
20
40
60
80
100
Settlement (mm)
Time(Days)
Kh/Ks=2
Kh/Ks=3
Kh/Ks=4
Kh/Ks=5
(c)
r
s
/r
m
=4
Ū
= 90%
t = 36.0
t = 45.0
t = 53.0
t = 63.0
0
50
100
150
200
250
300
0
20
40
60
80
100
Settlement (mm)
Time(Days)
Kh/Ks=2
Kh/Ks=3
Kh/Ks=4
Kh/Ks=5
(d)
r
s
/r
m
=5
Ū
= 90%
t = 37.0
t = 47.0
t = 60.0
t = 67.0
0
10
20
30
40
50
60
70
0
20
40
60
80
100
Excess pore pressure (kPa)
Time(Days)
Kh/Ks=2
Kh/Ks=3
Kh/Ks=4
Kh/Ks=5
(a)
r
s
/r
m
=2
Fullheight of
embankment reached
0
10
20
30
40
50
60
70
80
0 10 20 30 40 50 60 70 80 90 100
Excess pore pressure (kPa)
Time(Days)
Kh/Ks=2
Kh/Ks=3
Kh/Ks=4
Kh/Ks=5
(b)
Ū
= 90%
r
s
/r
m
=3
Fullheight of
embankment reached
0
10
20
30
40
50
60
70
80
0
20
40
60
80
100
Excess pore pressure (kPa)
Time(Days)
Kh/Ks=2
Kh/Ks=3
Kh/Ks=4
Kh/Ks=5
(c)
r
s
/r
m
=4
Fullheight of
embankment reached
0
10
20
30
40
50
60
70
80
0
20
40
60
80
100
Excess pore pressure (kPa)
Time(Days)
Kh/Ks=2
Kh/Ks=3
Kh/Ks=4
Kh/Ks=5
(d)
r
s
/r
m
=5
Fullheight of
embankment reached
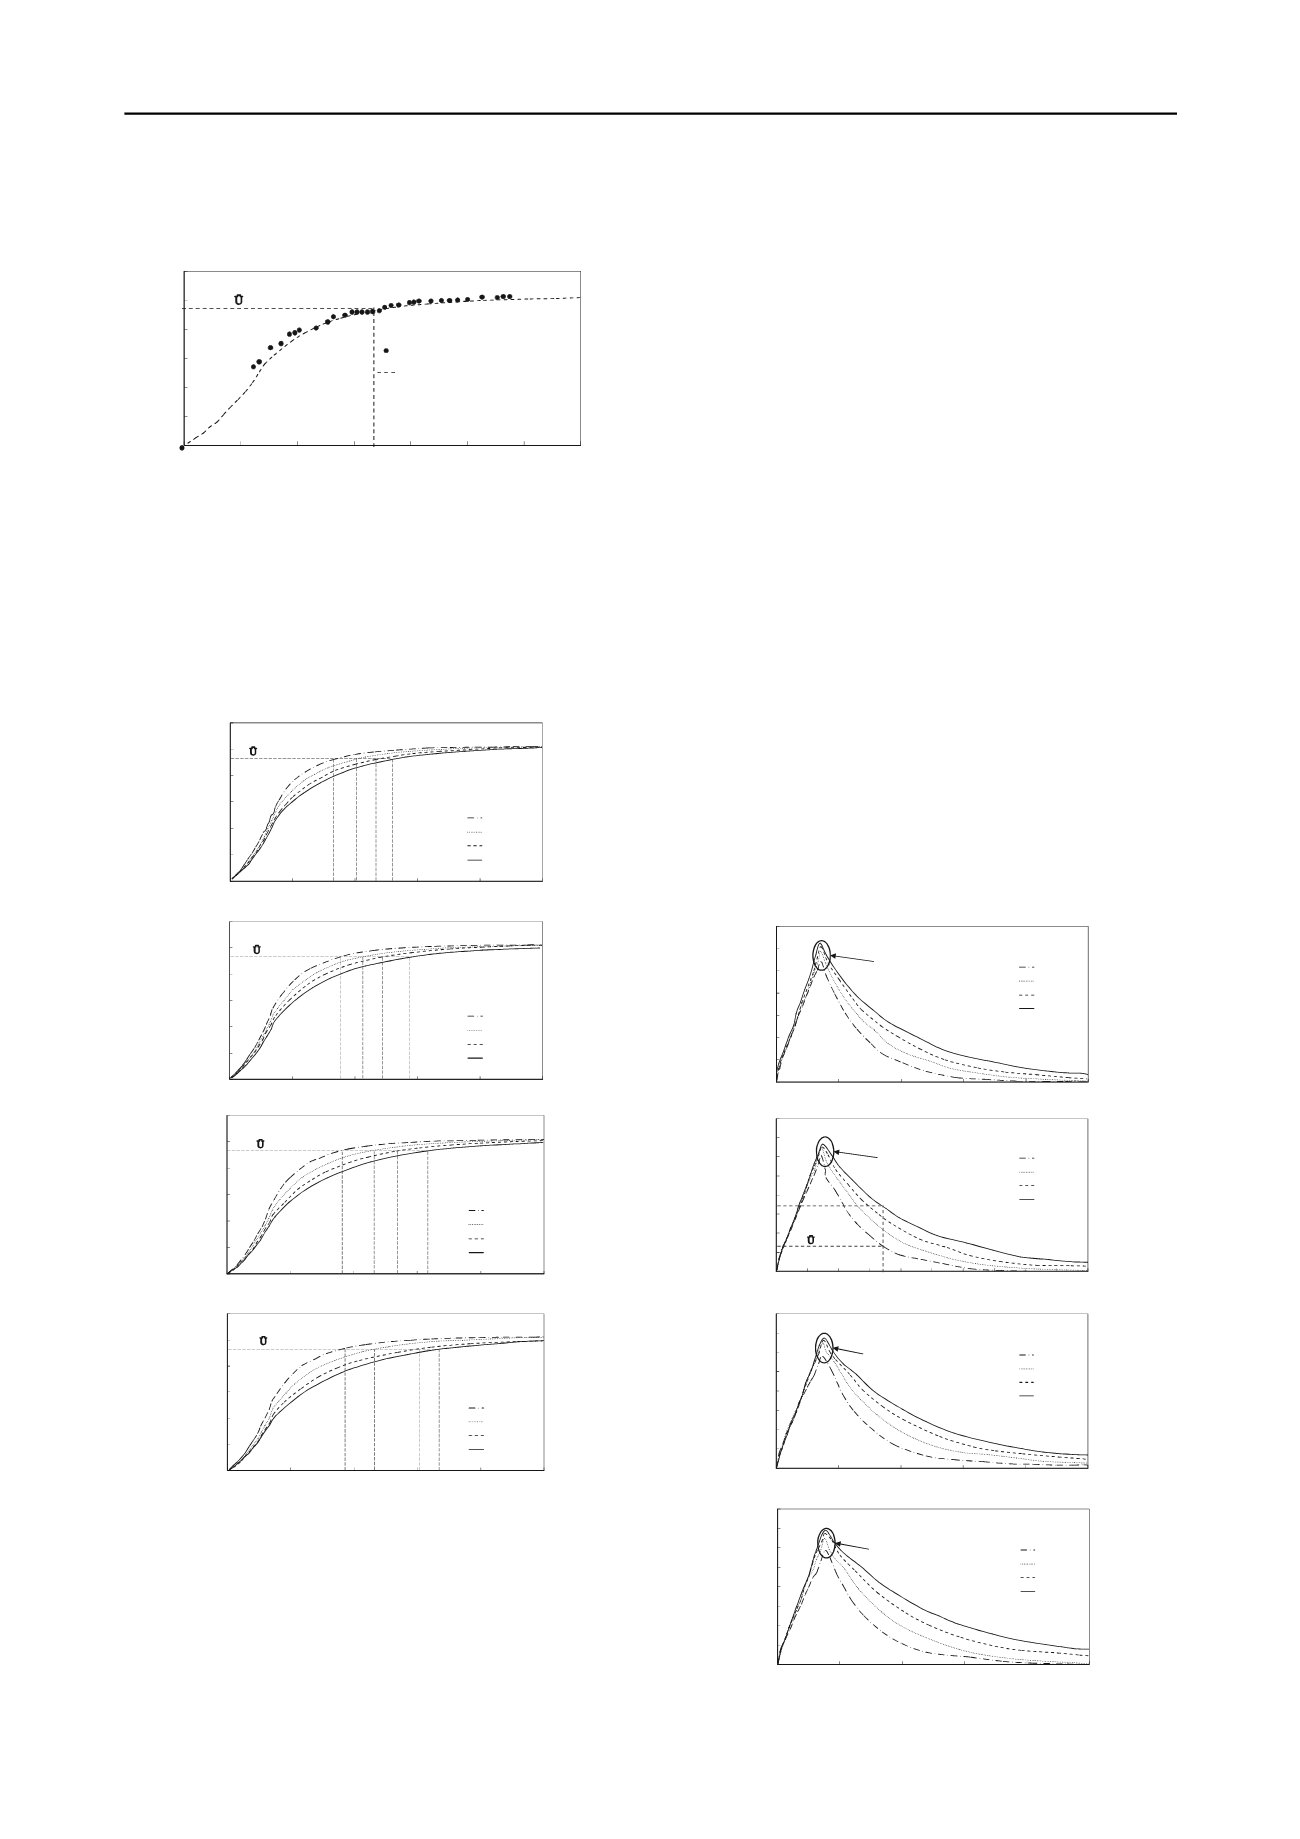
predicted to be approximately 258 mm. As illustrated in Figures
4 and 6, the field settlement is measured immediately after
placing the surcharge to the full height of 3 m (after 12 days).
Figure 6.Comparison of numerical results with filed data
3 PARAMETRIC STUDY AND DISCUSSION
Parametric studies have been conducted to investigate the
influence of the smear zone characteristics on the preloading
design simulating Chittagong Port case study with the details
presented in the previous section. For this purpose, k
h
/k
s
(permeability ratio) and r
s
/r
m
(extent ratio) have been changed
from 2 to 5. Figure 7 illustrates the parametric study results for
settlement-time relationships.
Figure 7. Parametric study results for Chittagong port case history at
point G1; (a) r
s
/r
m
=2; (b) r
s
/r
m
=3; (c) r
s
/r
m
=4; and (d) r
s
/r
m
=5
According to Figure 7, the settlement curves are converged to a
unique value of approximately 258 mm, which is the primary
consolidation settlement. The required time to obtain 90% of
primary consolidation settlement (232 mm) has been considered
to investigate the effect of smear zone properties on
consolidation process. According to Figure 7a, the minimum
time of 34 days is needed to achieve 90% degree of
consolidation, considering k
h
/k
s
=2 and r
s
/r
m
=2. When smear
zone properties are k
h
/k
s
=5 and r
s
/r
m
=5, the required time would
be the maximum and equal to 67 days, which is approximately
twice longer than the minimum (see Figure 7d). According to
the settlement curves in Figure 7, the influence of smear zone
permeability variations is more critical when the smear zone
extent ratio is larger. For instance the required time to obtain
90% degree of consolidation has been increased by 56% (from
34 days to 53 days) changing the permeability ratio from 2 to 5
considering the extent ratio equal to 2, while this boost is 80%
(from 37 days to 67 days) for extent ratio of 5.
The general trend in Figures 7(a)-7(d) shows that changing
the permeability ratio in a smaller range results in large
variations of the required time to obtain 90% degree of
consolidation considering a constant extent ratio. According to
Figure 7(a), the consolidation time is increased by 23% by
varying the permeability ratio from 2 to 3, while this change is
17% and 12% when the permeability ratio is changed from 3 to
4 and 4 to 5, respectively.
Figure 8 illustrates the numerical parametric study results
investigating the influence of the smear zone properties on the
excess pore water pressure (EPWP) dissipation. Graphs are
plotted for point G2 located at the depth of 4 m (see Figure 3).
Figure 8 confirms that increasing the permeability and extent
ratios prolongs the pore water pressure dissipation process
considerably. According to Figure 8, the permeability ratio is
more critical parameter than the extent ratio, although the
influence of extent ratio variation on the consolidation time can
not be neglected. For example, according to Figure 8b, there is
160% difference between the predicted excess pore pressure
values after 34 days (90% of the field degree of consolidation)
for k
h
/k
s
=2 (EPWP=13 kPa) and k
h
/k
s
=5 (EPWP=34 kPa), while
keeping r
s
/r
m
=3.
Figure 8. Effect of smear zone properties on excess pore water pressure
dissipation for Chittagong port case history at point G2


