2580
Proceedings of the 18
th
International Conference on Soil Mechanics and Geotechnical Engineering, Paris 2013
CAUE
OCR
0.898
DSS
OCR
0.749
VST
OCR
0.902
UU
OCR
0.800
UC
OCR
0.932
c
rate
1.0+0.1
log
10
(strain rate/1%)
CIUC
(PI/20)
0
= 1
CAUC
(PI/20)
0
= 1
CAUE
(PI/20)
0.178
DSS
(PI/20)
0.0655
VST
(PI/20)
0.124
UU
(PI/20)
0
= 1
d
PI
UC
(PI/20)
0
= 1
Table 6 Statistics of Y data points (Source: Ching et al. 2013).
# pts.
Mean
COV
Mean of
ln(Y
i
),
i
Stdev of
ln(Y
i
),
i
Y
1
(CIUC)
637
0.404
0.316
-0.955
0.315
Y
2
(CAUC)
555
0.350
0.318
-1.090
0.280
Y
3
(CAUE)
224
0.184
0.324
-1.748
0.355
Y
4
(DSS)
573
0.241
0.399
-1.468
0.277
Y
5
(FV)
1057
0.275
0.416
-1.363
0.372
Y
6
(UU)
435
0.243
0.504
-1.523
0.463
Y
7
(UC)
387
0.223
0.611
-1.640
0.523
Table 7 Correlation matrix C for (X
1
, X
2
, …, X
7
)
(Source:
Ching & Phoon 2013).
X
1
(CIUC)
X
2
(CAUC)
X
3
(CAUE)
X
4
(DSS)
X
5
(FV)
X
6
(UU)
X
7
(UC)
X
1
(CIUC)
1.00
0.84
0.47
0.72
0.63
0.88
0.85
X
2
(CAUC)
0.84
1.00
0.39
0.78
0.35
0.7*
0.6*
X
3
(CAUE)
0.47
0.39
1.00
0.45
0.41
0.4*
0.3*
X
4
(DSS)
0.72
0.78
0.45
1.00
0.73
0.6*
0.5*
X
5
(VST)
0.63
0.35
0.41
0.73
1.00
0.64
0.46
X
6
(UU)
0.88
0.7*
0.4*
0.6*
0.64
1.00
0.68
X
7
(UC)
0.85
0.6*
0.3*
0.5*
0.46
0.68
1.00
* insufficient data pairs, estimated based on judgments
3 REDUCING UNCERTAINTY IN DESIGN PARAMETER
WITH BETTER AND/OR MORE TESTS
As mentioned earlier, it is simple to simulate virtual site
investigation data (Y
1
, Y
2
, …, Y
n
)
. First, obtain realizations of
independent
standard normal random variables U = (U
1
, U
2
, …,
U
n
)
using library functions in many softwares. Realizations of
correlated
standard normal random variables X = (X
1
, X
2
, …,
X
n
)
can be obtained using X = LU, in which L is the lower
triangular Cholesky factor satisfying C = LL
. Finally, each soil
parameter is obtained using Y
i
= F
-1
[
(X
i
)]. For lognormal
distribution, Y
i
= exp(
i
+
i
X
i
). Figures 1 & 2 already showed
the simulated data (Y
1
, Y
2
, …, Y
n
)
. This section will further
discuss how to use the simulated data to quantify the
uncertainty reduction in s
u
and
by incorporating the test
results from better and/or more tests.
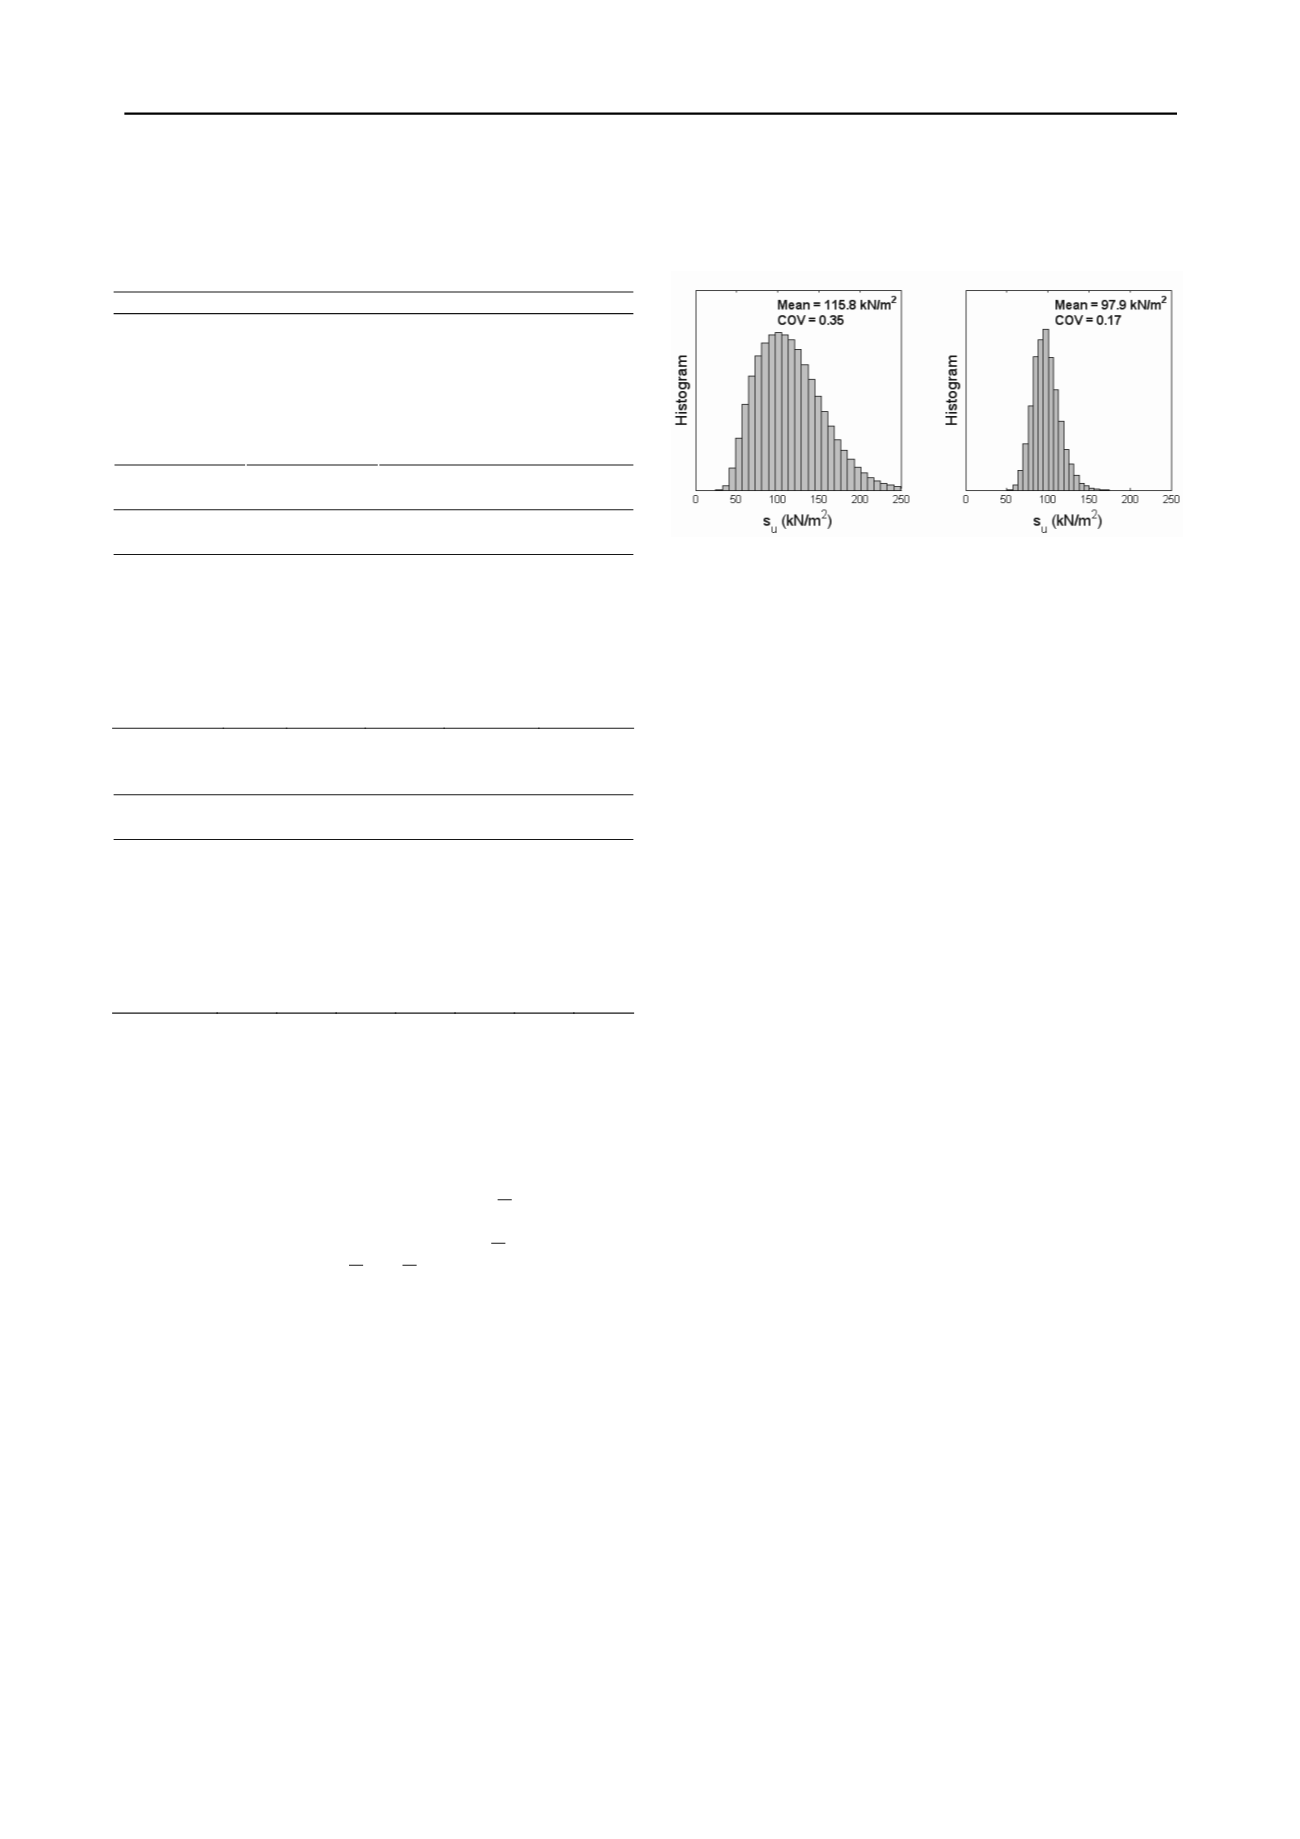
This is illustrated below using results presented in Figure 2.
The histogram of the simulated s
u
data for the same virtual site
is given in the left plot of Figure 3, showing the simulated s
u
data when no site-specific tests are conducted. Let us consider a
site investigation program consisting oedometer, CPTU, and
SPT N tests. Suppose the test results show that OCR is within
[9.5,13.1],
N
60
within
[7,9],
and
q
T
-
v
within
[1100kN/m
2
,1350kN/m
2
]. Based on the above information, the
conditional samples of s
u
can be easily obtained by filtering out
samples satisfying OCR
[9.5,13.1], N
60
[7,9], and q
T
-
v
’
[1100kN/m
2
,1350kN/m
2
]
simultaneously
from
the
population at large. The s
u
values associated with this filtered
set of (OCR, s
u
, N
60
, q
T
-
v
) values are therefore the conditional
s
u
samples. The histogram of these conditional samples is
shown in the right plot of Figure 3. It is clear that the
uncertainty in s
u
is significantly reduced, given the information
from better and/or more tests.
Figure 3. Histograms of the (conditional) s
u
samples.
4 CONCLUSION
The construction of “virtual sites” are demonstrated in this
paper using multivariate normal distributions calibrated from
actual soil property databases. By doing so, it is possible to
evaluate the reduction in the uncertainties associated with
design parameters as a function of better and/or more tests. The
practical goal is to establish an
actual
(not theoretical) link
between the cost of a site investigation program and the
potential design savings accrued from reliability-based design.
5 REFERENCES
Bolton, M.D. 1986. The strength and dilatancy of sands.
Geotechnique
36(1), 65-78.
Ching, J., Phoon, K. K. and Chen, Y.C. 2010. Reducing shear strength
uncertainties in clays by multivariate correlations.
Canadian
Geotechnical Journal
47(1), 16-33.
Ching, J. and Phoon, K.K. 2012a. Modeling parameters of structured
clays as a multivariate normal distribution, Canadian Geotechnical
Journal 49(5), 522-545.
Ching, J., Chen, J.R., Yeh, J.Y., and Phoon, K.K. 2012b. Updating
uncertainties in friction angles of clean sands. ASCE Journal of
Geotechnical and Geoenvironmental Engineering 138(2), 217-229.
Ching, J. and Phoon, K.K. 2013. Multivariate distribution for undrained
shear strengths under various test procedures, submitted to
Canadian Geotechnical Journal.
Ching, J., Phoon, K.K., and Lee, W.T. 2013. Second-moment
characterization of undrained shear strengths from different test
modes, to appear in Geotechnical Special Publication honoring
Professor F. H. Kulhawy.
Goldsworthy, J.S., Jaksa, M.B., Fenton, G.A., Griffiths, D.V., Kaggwa
W.S., and Poulos, H.G. 2007. Measuring the risk of geotechnical
site investigations. Proc. Geo-Denver 2007, Denver.
Jaksa, M.B., Goldsworthy, J.S., Fenton, G.A., Kaggwa, W.S., Griffiths,
D.V., Kuo, Y.L., and Poulos, H.G. 2005. Towards reliable and
effective site investigations. Géotechnique 55(2), 109-121.
Ladd, C.C. and Foott, R. 1974. New design procedure for stability in
soft clays. ASCE Journal of Geotechnical Engineering Division
100(7), 763-786.
Mesri, G. and Huvaj, N. 2007. Shear strength mobilized in undrained
failure of soft clay and silt deposits.
Geotechnical Special
Publication 173
, ASCE, Reston.
Phoon, K.K., Ching, J., and Huang, H.W. 2012. Examination of
multivariate dependency structure in soil parameters.
GeoCongress
2012 – State of the Art and Practice in Geotechnical Engineering
(GSP 225),
ASCE, Reston, 2012, 2952-2960.


