2586
Proceedings of the 18
th
International Conference on Soil Mechanics and Geotechnical Engineering, Paris 2013
3.1
Stone columns on rigid base
Figure 3b presents the calculated
n
with depth for a particular
case where embankment load is applied on stone columns that
are founded on rigid base. The selected column configuration
and parameters are shown in Figure 2. Note that the
embankment fill was modeled as soil elements and the arching
stresses developed above the column have been accounted for in
the FEA model.
Figure 2. Stone column on rigid base
If the column and soil were appraised as elastic materials,
the calculated
n
(dash line in Figure 3b) increases from 5 at the
top of column, which is consistent with design chart solution
provided in FHWA (1983) for embankment supporting
columns, to about 14 at depth, which is commensurate with the
equal strain solution (soil and column settle at the same rate at
depth) given by Balaam and Poulos (1982).
When the column and soil are modeled as Mohr-Coulomb
materials, yielding elements begin to form at the column top
after a small load (~20kPa) is applied, leading to a reduction in
stress concentration. The yielding of the column (hence the
reduction of
n
) progresses downwards through the column as
the applied load level increases (see the solid curves in Figure
3b). Figure 3a shows the stress state of the unit-cell model after
the application of maximum embankment load. It indicates that
most yielding elements are confined within the column
periphery. The soil is generally elastic and therefore the soil
friction angle has little influence on the solution.
Figure 3. Stone column with rigid base (elasto-plastic solution)
Figure 3c shows a normalised plot in which the depth of the
column,
z
, was normalised by q
a
/
γ
, where q
a
is the applied fill
stress and
γ
is the total unit weight of the soil. It is found that
the normalised stress concentration curves for the different load
levels (
≥
40kPa) lie on a single curve. The turning point of the
normalized curve corresponds to the transition from the upper
yielding zone to the lower non-yielding zone, which occurs at
different z for the different q
a
. For example, point
A
in Figure 3c
occurs at
z·
γ
/q
a
= 4. When q
a
=40kPa and
γ
=17kN/m
3
,
z
= 9.5m
(B in Fig 3b). Conversely, when
q
a
= 60kPa, z
≈
14m (Point C).
Figure 4 presents a series of normalised curves for the
n
value under different modulus ratios, column spacing and
friction angles of the stone column. For a given column spacing
ratio and friction angle, the stress concentration is higher for
higher modulus ratio E
c
/E
s
. Conversely, for the columns with a
given modulus ratio, the extent of the yielding zone, and hence
the reduction of stress concentration, is greater as the spacing
ratio increases even though the maximum stress ratio in the
columns is ultimately similar. This occurs because there is less
confinement for the spaced columns, leading to greater yielding
zone and stress reduction within columns. A comparison of the
corresponding curves in Figures 4a and 4b shows that the loss
of stress concentration due to yielding is more severe for
column material having a lower angle of internal friction.
Figure 4. Stone column with rigid base
3.2
Stone columns on compressible soils (elastic appraisal)
For stone columns founded on compressible soil, the elastic FE
solution has indicated that there exists a lower equal settlement
plane, below which the columns move more than the soil to
mobilise positive skin resistance of the soil. More load is
transferred from the column to the surrounding soil and
therefore the stress concentration
n
reduces (see Figure 5a).
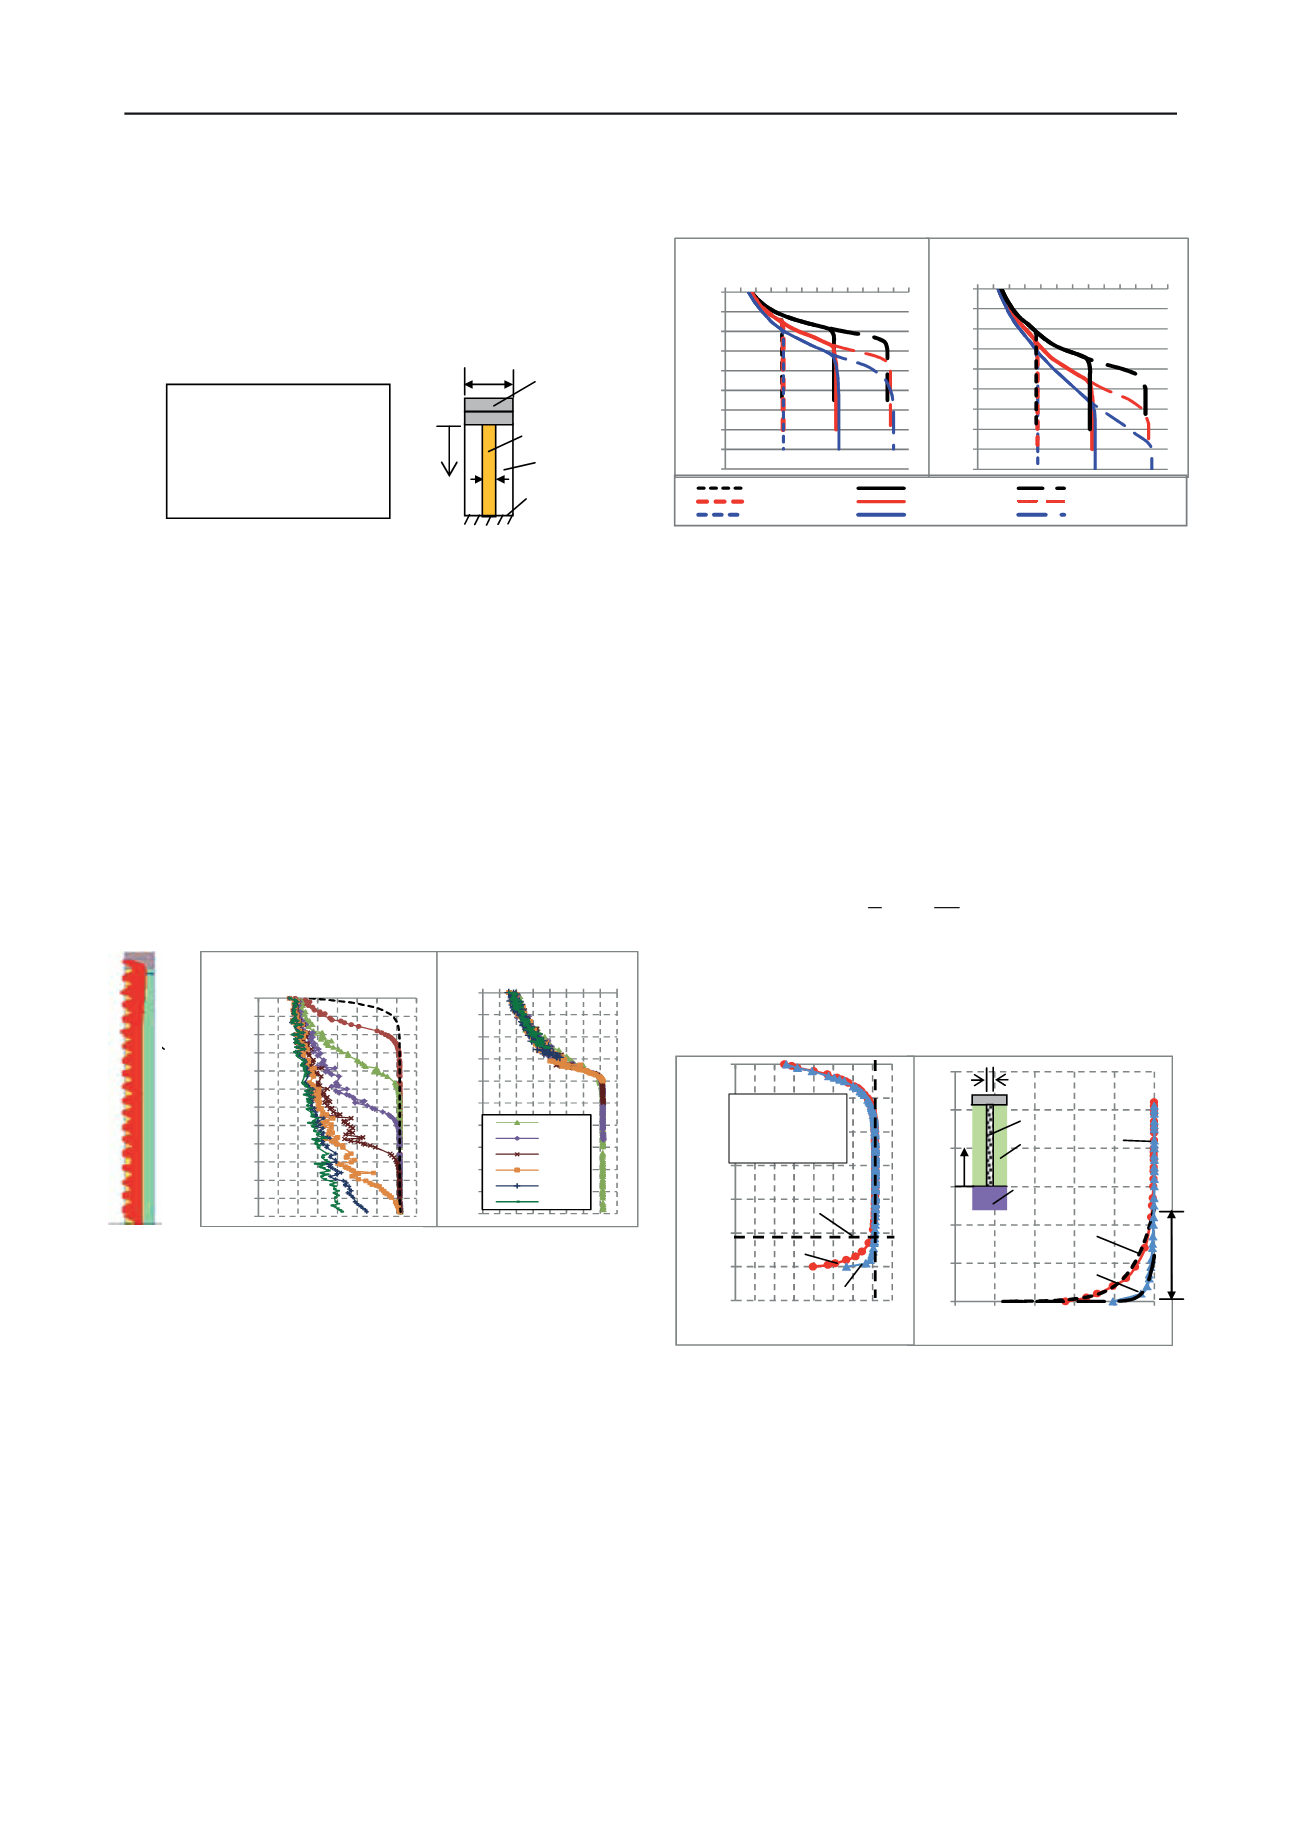
Figure 5b shows a plot of normalised distance from the
column base
y/a
(
y
and a defined in inset in Figure 5b) versus
stress concentration reduction ratio
r
(=
n
/
n
max
) for the
corresponding elastic FEA results given in Figure 5a. The
n
max
is the maximum computed
n
value based on elasticity as shown
in Figure 5a. The FEA results for
r
near the column base can be
approximated by the following logarithmic relationship.
= 1
/
(for
y/a
≤
ξ
)
(
3
)
where
ξ
is the influenced zone (also normalized by the column
diameter
a
) that is measured from the base of the column to the
equal settlement plane (where
r
= 1). The magnitude of
m
controls the rate of reduction of
r
with
y/d
. The higher the
m
the
more rapid reduction of
r
would be towards the column tip.
Figure 5. Stone column with compressible base -elastic solution
Figure 5b indicates that as the Young’s modulus
E
base
of the
soil beneath the columns increases, the extent of
ξ
reduces.
Also, the ratio
r
reduces more rapidly towards the column tip
(i.e.
m
increases) as
E
base
increases. Figure 6 presents the
computed
ξ
and
m
for the different
E
base
/
E
column
and E
base
/E
soil
ratios based on elastic FEA. The following points can be drawn:
•
The influenced zone
ξ
at the column base reduces as
E
base
/
E
column
increases. The reduction may be
approximated by a straight line in
ξ
vs.
log(
E
base
/
E
column
) plot. Curves 1 and 4 in Figure 6a
delineate such relationships for column spacing
b
/
a
of 3 and 2, respectively. A curve in between
representing
b
/
a
= 2.5 has not been shown for
clarity of the figure. Note that these curves can
apply to cases where E
base
/E
soil
≥
10 as
E
soil
has
negligible effect on the shape of
r
under this
condition. For a particular
b
/
a
ratio, the
ξ
shows a
Clay:
E´=3MPa,
φ
´=22°,
c´=1kPa,
γ
total
= 17kN/m
3
Column: E´= 60MPa,
φ
´= 40°,
c´= 0kPa,
γ
total
= 22kN/m
3
ν
´
clay
=
ν
´
column
= 0.3; b/a = 2;
Ko = 0.5
n
max
A
Embank.
fill
(a)
B
C
60kPa
80kPa
100kPa
120kPa
40kPa
Fill
Load
20kPa
140kPa
Elastic
solution
Plastic
stress
point
(a)
(b)
n
max
z
b
Stone-
column
Soil
Rigid
boundary
a
0
1
2
3
4
5
6
7
8
9
10
0 2 4 6 8 10121416
z
γ
/ q
a
Stress Concentration
n
40kPa
60kPa
80kPa
100kPa
120kPa
140kPa
-24
-22
-20
-18
-16
-14
-12
-10
-8
-6
-4
-2
0
0 2 4 6 8 10 12 14 16
Depth z below top of stone column (m)
Stress Concentration ratio
n
(b)
(c)
0
2
4
6
8
10
12
14
16
18
0 2 4 6 8 1012141618202224
z
γγ
/ q
a
Stress Concentration n
0
2
4
6
8
10
12
14
16
18
0 2 4 6 8 1012141618202224
z
∙
γγ
/ q
a
Stress Concentration
n
(a)
(b)
φ
´column
= 40°
φ
´column
= 35°
b/a = 2; Ec/Es = 10
b/a = 2; Ec/Es = 20
b/a = 2; Ec/Es = 30
b/a = 2.5; Ec/Es = 10
b/a = 2.5; Ec/Es = 20
b/a = 2.5; Ec/Es = 30
b/a = 3; Ec/Es = 10
b/a = 3; Ec/Es = 20
b/a = 3; Ec/Es = 30
0
1
2
3
4
5
6
0 0.2 0.4 0.6 0.8 1
normalised
y/a
from column base
r = n / n
max
-14
-12
-10
-8
-6
-4
-2
0
0 2 4 6 8 10 12 14 16
Depth z below top of column
Stress concentration
n
E´
soil
E´
column
E´
base
y
a
ξ
Eq.3:
ξ
=2.45, m = 9
E
base
= 50MPa
Eq3:
ξ
=1.2, m = 27
E
base
=
200MPa
FEA
results
E´
column
=60MPa
E´
soil
=3MPa
b/
a
=2
E´
base
=50MPa
E´
base
=200MPa
Lower equal
settlement plane


