2594
Proceedings of the 18
th
International Conference on Soil Mechanics and Geotechnical Engineering, Paris 2013
Specific gravity
2.65
The cement used in this study is normal Portland cement type I.
The same sources of cement and sand were used for all the
specimens to eliminate all risk of material discrepancy.
2.2
Sample Preparation
The specimens used in the UCS tests were prepared in
cylindrical PVC split molds to facilitate the extraction of the
sample after formation. For a given test, the material quantities
were determined based on the target fiber content, cement
content, and sand density. Initially, the sand and cement were
mixed in dry conditions before adding 5% by weight of water
necessary for the hydration of the cement and blending of the
mixture. The fibers were then mixed thoroughly with the sand-
cement to obtain a final homogenous mix with well-distributed
and untangled fibers. It is to be noted that all the mixing was
done manually since the use of a mechanical mixer could result
in tangling and clodding of the fibers and their segregation from
the soil mixture. Each layer was then compacted into the mold
to the required height under the effect of a compaction tool
which was specifically designed for the purpose. The top
surfaces of the 1
st
and 2
nd
layers were scratched prior to putting
the new material for the subsequent layer in order to obtain, to
the extent possible, a homogenous specimen and eliminate the
risk of weak shear planes at the contact surface between two
layers.
A curing time of 8 ± 1 days was chosen to allow the cement
enough to time to set. Since the curing time is not a parameter
which was studied in the testing program, the period of 8 days
was chosen as an average time which provides a significant
period for curing without unduly prolonging the overall time
needed for each test.
2.3
Unconfined Compression Strength Tests
The UCS tests were performed according to ASTM D2166 with
specimens having a diameter of 5.5 cm and a height of 11 cm
giving an acceptable height to diameter ratio of 2. The machine
used in the tests is a HUMBOLDT HM-3000 loading frame
fully automated and computer software-controlled. The vertical
deformation is recorded by an LVDT, while the resisting axial
load is recorded by load cells of different capacities. The rate of
application of the strain is 0.05 cm/min. The data were recorded
automatically every 4 seconds and the test was continued until
failure occurred or when the axial strain exceeded 15%.
3 TEST RESULTS AND ANALYSIS
Results from twenty unconfined compression tests on
fiber/cement reinforced sands are presented in this paper. The
tests were restricted to lightly cemented sands (cement content
= 0.5% and 1.0%) that were reinforced with fibers of different
lengths (6mm, 12mm, and 20mm) at different fiber contents
(0%, 0.25%, 0.5%, and 1.0%). The analysis of the tests includes
an assessment of the stress-strain behavior and the dependency
of the unconfined compressive strength on the reinforcement
parameters (fiber content, fiber length, and cement content).
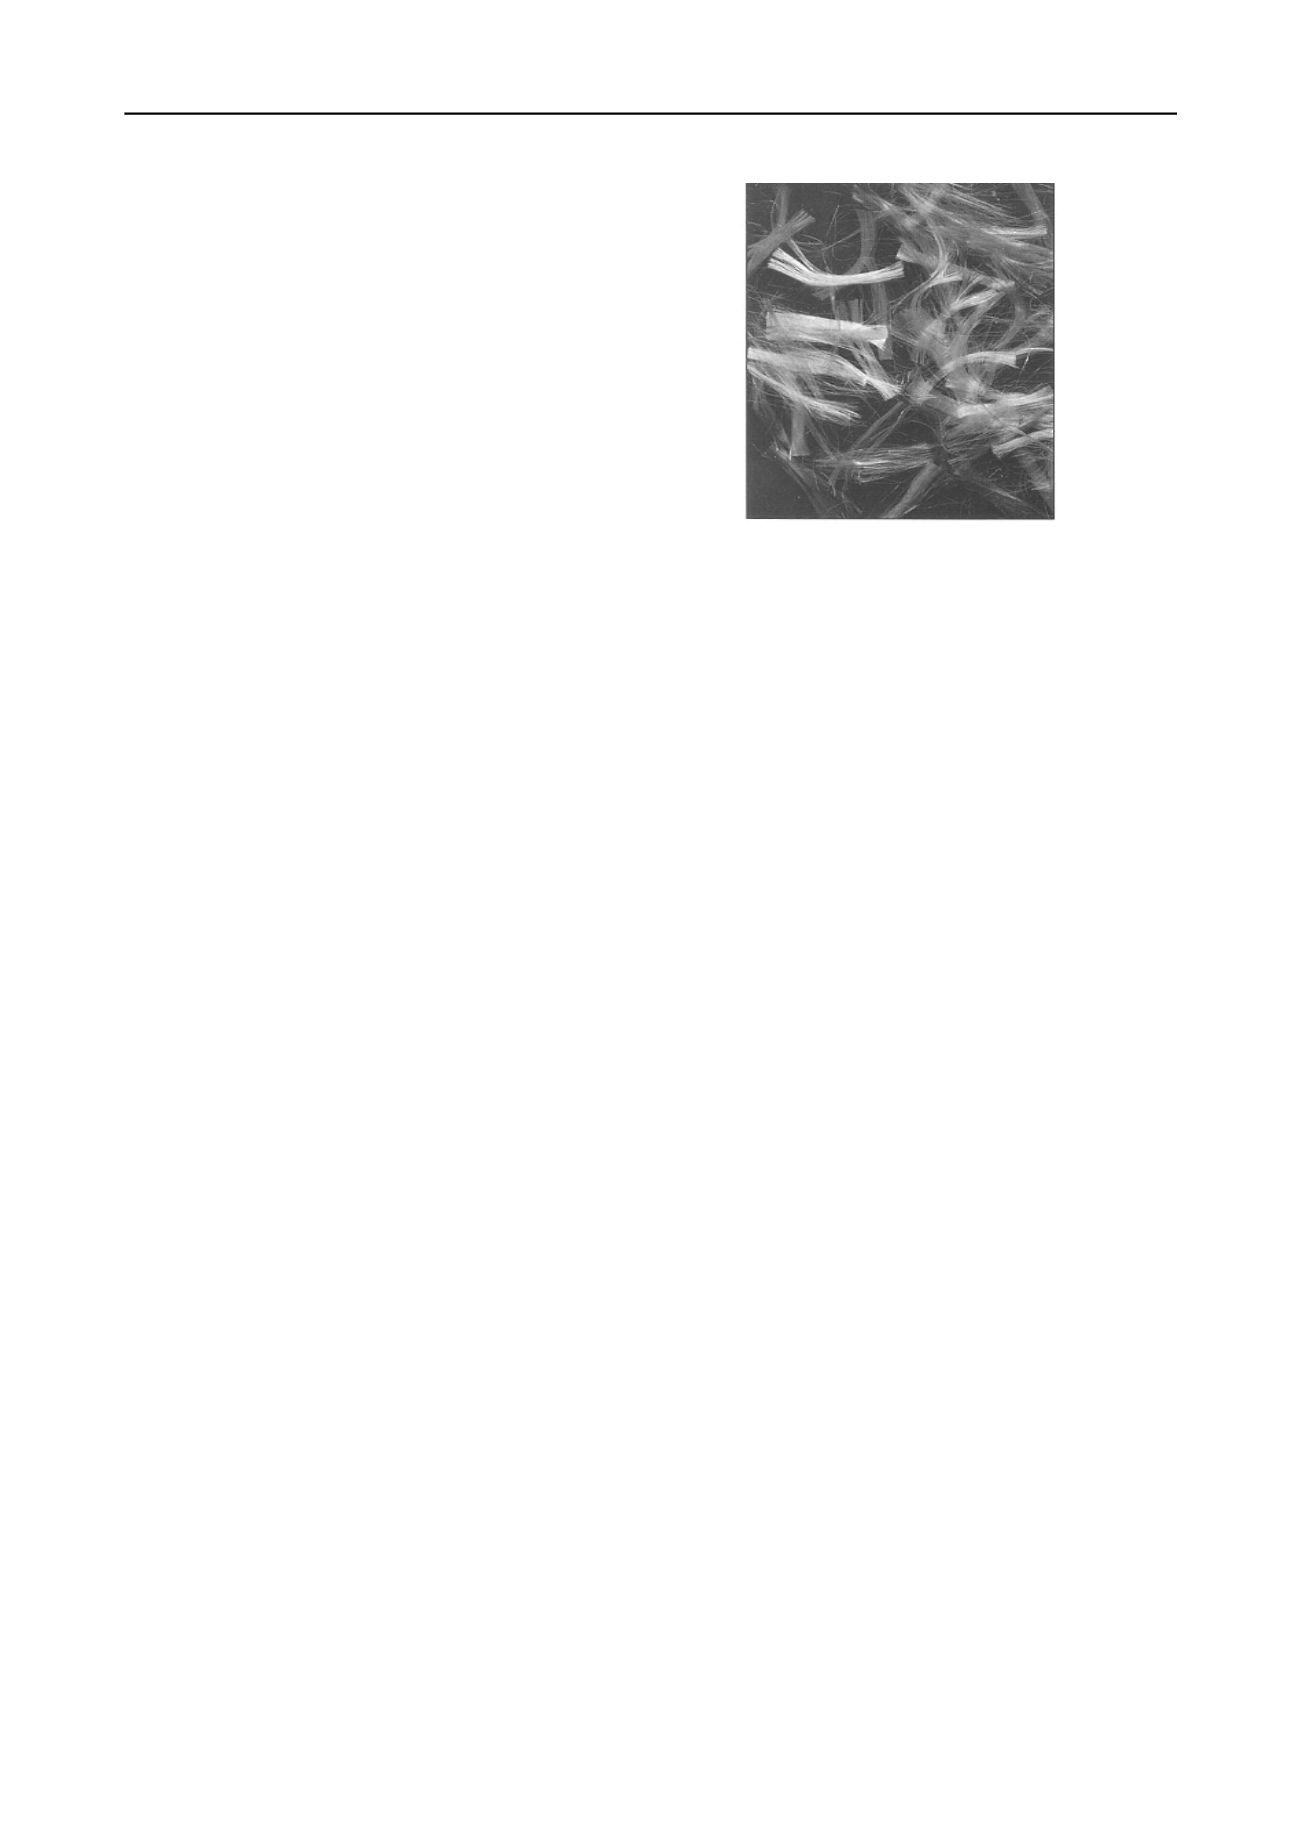
Figure 1. Polypropylene fibers used in the experiments.
3.1
Stress-Strain Response
The stress-strain response of specimens that were stabilized
with a cement content of 0.5% is presented in Figs. 2a, 2b, and
2c for fiber contents of 0.25%, 0.5%, and 1.0%, respectively.
The response of specimens that were reinforced with a cement
content of 1.0% is similarly presented in Figs. 3a, 3b, and 3c.
On each of the plots, stress-strain curves are presented for
different fiber lengths (6mm, 12mm, and 20mm) and for the
specimen that was prepared with no fibers.
For specimens that were reinforced with a cement content of
0.5% (Fig. 2), the stress strain curves indicate a consistent
increase in stress with strain up to a maximum peak stress value
at which failure occurs. The value of the peak and the post peak
behavior are a function of the cement content, fiber content, and
fiber length. The failure mode as indicated by the value of the
strain at failure and by the post peak response is found to be
more ductile as the fiber content increased from 0% to 1.0%. In
addition, for a given fiber content, ductility was found to
improve as the length of fibers increased from 6mm to 20mm.
For the higher cement content of 1.0% (Fig. 3), the behavior
of the composite specimens was found to be more brittle
compared to their lightly cemented counterparts. The inclusion
of fibers added some ductility to the mode of failure, but this
effect was minor for the smaller fiber contents (0.25% and
0.50%). The improvement in the mode of failure was only
evident in the higher fiber content of 1.0% at all fiber lengths
and for the intermediate fiber content of 0.5%, but only at the
larger fiber length of 20mm.
3.2
Effect of Fiber/Cement on Stiffness
The stress-strain response at the onset of loading in Figs. 2 and
3 could be used as a measure of stiffness for the fiber/cement
reinforced specimens. For the smaller cement content, results on
Fig. 2 indicate that the stiffness of the specimens was not
affected by the addition of fibers except for cases involving the
longest fibers (20mm) with fiber contents of 0.25% and 0.50%
where the stiffness was found to be improved. For cases
involving fibers with a high fiber content of 1.0%, no
improvements were observed in the stiffness, irrespective of the
fiber length.
A slightly different behavior was observed for the higher
cement content of 1.0% where slight improvement in stiffness
were observed for the shorter fibers at the smaller fiber
contents, with the improvements in stiffness vanishing for the
longest fiber and the highest fiber contents, where slight
reduction in stiffness was actually observed. This indicates that
fibers could result in a softer initial response for higher cement
contents, higher fiber content, and longer fibers.


