2603
Technical Committee 211 /
Comité technique 211
Table 1. Origin soil physics parameters
The analysis of the results shows that the liquid limit (w
l
) is
shifting towards the zone of w
l
= 35
–
45 %, irrespective of the
initial values. The high values of the liquid limit decrease
drastically, those situated near the zone practically stagnate, and
a slight increase was experienced at the low liquid limit values.
Similarly to the plastic limit (w
p
) a tendency of shifting towards
a certain zone can be experienced, similarly to the behavior of
the liquid limit. This zone is situated at w
p
= 25
–
35 %. The
plastic limit is generally increasing, however in case of fat clays
having high plasticity limit stagnation or decrease can be
experienced.
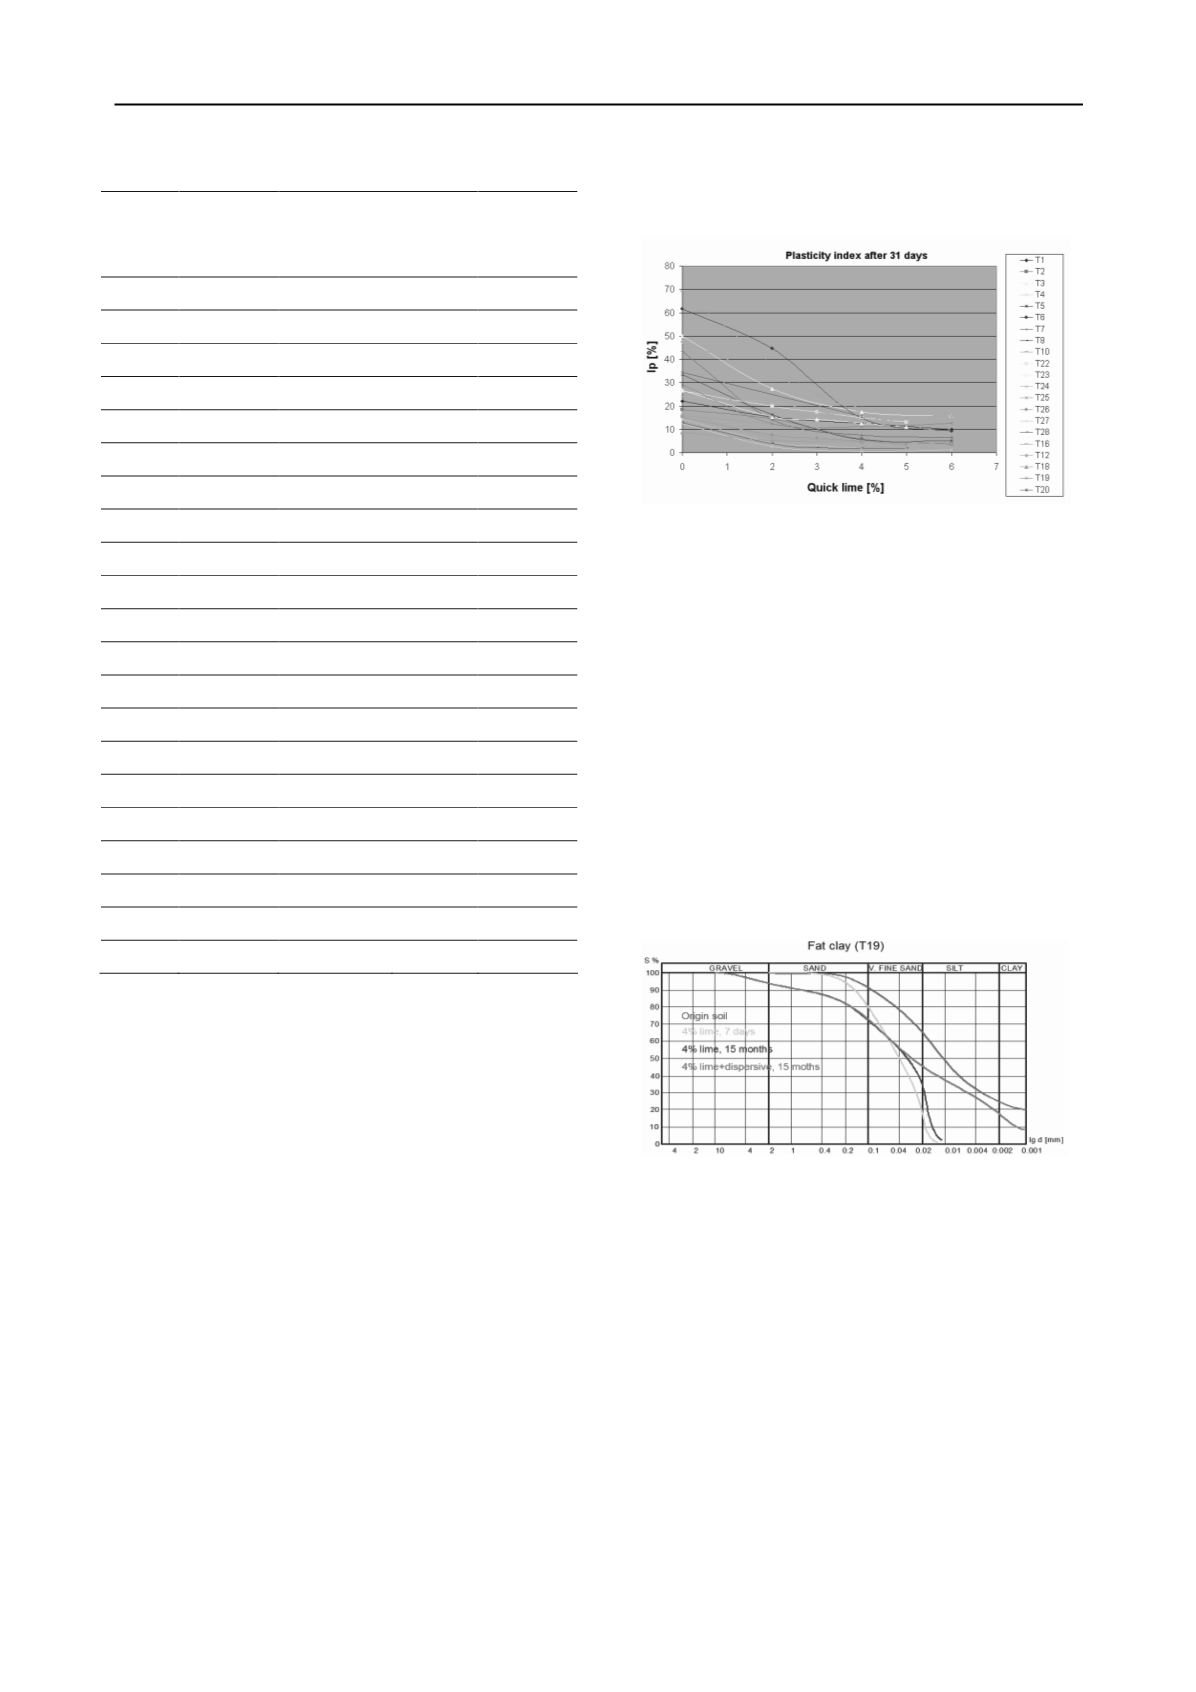
The alteration of Atterberg-limits in the value of the
plasticity index (Ip) also leads to shifting towards a zone (Figure
3). The value of plasticity index is shifting to the zone delimited
by Ip = 5
–
15 %, corresponding to very fine sand and silt type
soils, according to the description of the bound soils.
An investigation of the temporal aspects of the impact
shows that the above tendencies appear during the first hour
following mixing, however the most extreme alteration of the
parameters could be measured appr. on day 7. The following
period was characterized by stagnation, with slight shifts in case
of certain soils toward the properties of an untreated soil.
4.2.
Alteration of the grain distribution
The process of increased crumbliness and the more granular soil
experienced at the plasticity index were tried to be delimited by
an investigation of the grain size distribution. During the grain
size distribution test and hydrometration of soil samples treated
with lime, the soil particles settled very rapidly. The settling
process took 5-15 minutes.
Figure 3. Alteration of the plasticity index plotted against lime dosage
This rapid sedimentation process produces the grain size
distribution curve characterizing soils treated with lime. The
section situated above hydrometration of the curve shows a
picture identical with that of an untreated soil, plunging
however at the section below 0.063 mm. The stabilized soils
maintain this character later on, with the only difference that
also the proportion of particles of above 0.063 mm becomes
slightly higher. These alterations are visualized in Figure 4.
As was suspected this intensive coagulation that is not
characteristic for the hydrometration of soils of natural
stratification is triggered by the cation exchange taking place
during lime stabilization. In order to prove it, the
hydrometration was performed with a 15 months old sample, by
means of admixing a significant quantity of dispersive material
(sodium hexametaphosphate) to the mixture prepared in the
measuring glass. During the test, a long lasting, continuous
precipitation could be experienced as usual for natural soils. The
obtained curve of grain size distribution is indicated in Figure 4
in purple color, showing a high conformity with the curve of an
untreated soil.
Figure 4. Alteration of the grain size distribution caused by a lime
treatment of medium clay soil
It can be observed with the lapse of time that the more
frequent presence of particles of above 0.063 mm of particle
diameter can be explained with two other chemical processes of
the lime stabilization: the cementation and carbonatization. The
investigation of particles of above 0.063 mm by means of
microscope and X-ray diffraction demonstrated the presence of
aluminates and silicates leading to cementation, together with
carbonatized limestone particles.
The results obtained from the investigation of plasticity and
the grain size distribution show that the particles of a treated
soil coagulate, cohere, resulting from the cation exchange. This
coagulation creates a strong connection between the soil
particles that cannot be dissolved by water, rendering it durable
in the soil.
The coagulation is able to eliminate one of the biggest
disadvantages of bound soils, i.e. the relatively high particle
surface binding high quantities of water. The high level of water
intake reduces namely the shearing strength and consequently
the load bearing capacity of the soils.
Sign
of soil
Plasticity
index
[%]
Grain size
< 0.1mm
[%]
Friction
angle
[
o
]
Cohesion
[kPa]
T1
22,0
88,4
10.5
61.7
T2
18,5
76,6
22.4
88.3
T3
50,0
96,4
11.9
117
T4
12,3
87,6
25.6
72.9
T5
33,5
98,7
11.4
37.6
T6
61,5
99,3
18.2
123
T7
43,4
98,8
22.8
114.8
T8
22,9
90,5
T9
-
36,8
T10
69,2
99,5
T11
34,4
94,1
26.9
124
T12
47,5
-
T13
-
70,2
T14
-
41,2
T15
38,5
-
14.5
104.5
T16
34,8
92,8
20.9
82.5
T17
24,8
88,2
T18
8,8
76,1
T19
29,1
91,8
T20
6,4
74,2
T21
27,0
-


