2595
Technical Committee 211 /
Comité technique 211
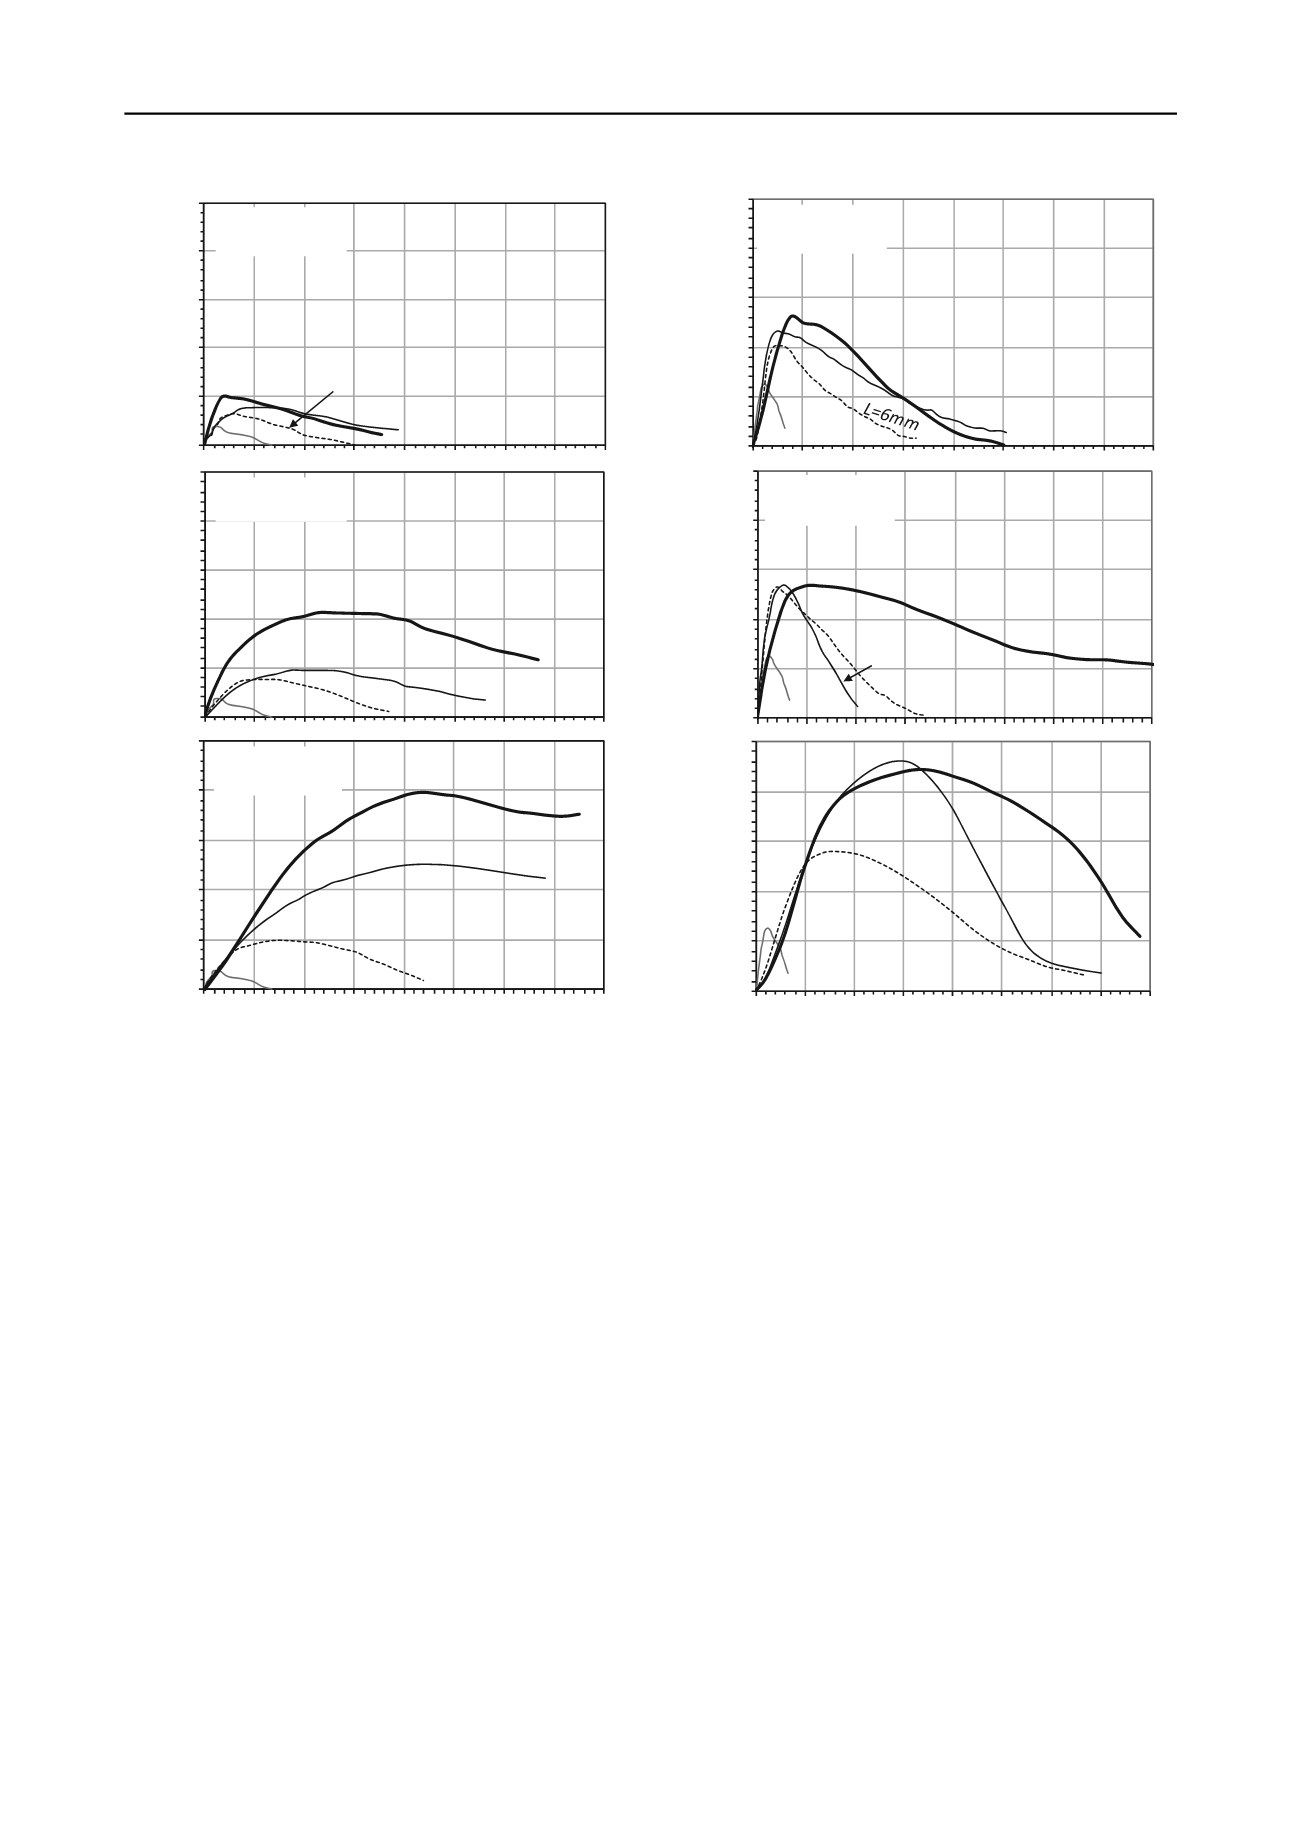
Figure 2. Stress-strain response for cement content of 0.5%.
3.3
Effect of Fiber Content on UCS
For a given cement content, the stress-strain curves in Figs. 2
and 3 indicate that the unconfined compressive strength
increases as the fiber content increases. The unconfined
compressive strength for each test was computed and plotted as
a function of the fiber content in Figs. 4a and 5a for cement
contents of 0.5% and 1.0%, respectively. For the two cement
contents and for all fiber lengths, results indicate a consistent
increase in the unconfined compressive strength with fiber
content. For a cement content of 0.5%, the UCS increased from
about 15 kPa (no fibers) to about 40 kPa (1.0% fibers) for the
shortest fiber length of 6mm, and from 15 kPa (no fibers) to
about 160 kPa (1.0% fibers) for the longest fiber length of
20mm. For the larger cement content of 1.0%, the UCS
increased from about 50 kPa (no fibers) to about 112 kPa and
178 kPa, for the shortest and longest fibers at 1.0% fiber
content, respectively.
In order to obtain a quantitative measure of the degree of
improvement in the unconfined compressive strength, the ratio
of the UCS with fibers to the UCS without fibers was computed
and plotted versus the fiber content in Figs. 4b and 5b. These
results indicate that the cement content played a significant role
in defining the improvement ratio, with the ratio varying from 2
(smallest fiber content and fiber length) to 10 (largest fiber
content and fiber length) for a cement ratio of 0.5%, and from
about 2 to 4 for the larger cement ratio of 1.0%.
0
40
80
120
160
200
0.0 1.0 2.0 3.0 4.0 5.0 6.0 7.0 8.0
Compressive Stress (kPa)
Axial Strain (%)
L=12mm
L=20mm
No Fibers
1.0% Cement
0.25% Fibers
0
40
80
120
160
200
0.0 1.0 2.0 3.0 4.0 5.0 6.0 7.0 8.0
Compressive Stress (kPa)
Axial Strain (%)
L=6mm
L=12mm
L=20mm
No Fibers
1.0% Cement
0.50% Fibers
0
40
80
120
160
200
0.0 1.0 2.0 3.0 4.0 5.0 6.0 7.0 8.0
Compressive Stress (kPa)
Axial Strain (%)
L=6mm
L=12mm
L=20mm
No Fibers
1.0% Cement
1.0% Fibers
0
40
80
120
160
200
0.0 1.0 2.0 3.0 4.0 5.0 6.0 7.0 8.0
Compressive Stress (kPa)
Axial Strain (%)
0.50% Cement
0.25% Fibers
L=20mm
L=12mm
L=6mm
0
40
80
120
160
200
0.0 1.0 2.0 3.0 4.0 5.0 6.0 7.0 8.0
Compressive Stress (kPa)
Axial Strain (%)
0.50% Cement
0.50% Fibers
L=6mm
L=12mm
L=20mm
No Fibers
0
40
80
120
160
200
0.0 1.0 2.0 3.0 4.0 5.0 6.0 7.0 8.0
Compressive Stress (kPa)
Axial Strain (%)
0.50% Cement
1.0% Fibers
No Fibers
L=6mm
L=12mm
L=20mm
Figure 3. Stress-strain response for cement content of 1.0%.
3.4
Effect of Fiber Length on UCS
The effect of the fiber length on the stress-strain response and
on the improvement in the UCS is evident in Figs. 2 to 5 and is
found to be dependent on the cement content. For a cement
content of 0.5%, as the fiber length increases, the unconfined
compressive strength increases and the strain at failure
increases, indicating improved ductility. The effect of fiber
length was found to be more evident at higher fiber contents
compared to lower fiber contents. For example, for the small
fiber content of 0.25%, the improvement ratio in the UCS
increased slightly from 1.7 to 2.6 (for fiber length of 6mm and
20mm) compared to the dramatic increase from 2.6 to 10.6 (for
fiber length of 6mm and 20mm) for the larger fiber content of
1.0%.
For the larger cement content of 1.0%, the effect of fiber
length on the unconfined compressive strength becomes
smaller. For the smaller fiber contents of 0.25% and 0.5%, the
difference in the measured values of the UCS is relatively
insignificant, with improvement ratios varying in the narrow
range of 1.6 to 2.0 (fiber content of 0.25%) and 2.1 to 2.15
(fiber content of 0.50%) for the shortest and longest fibers,
respectively. For the largest fiber content of 1.0%, the
improvement ratio increases from 2.2 to 3.7, as the fiber length
increases from 6mm to 20mm.


