2587
Technical Committee 211 /
Comité technique 211
lower value as E
base
/E
soil
reduces to less than 10,
although the trend of reduction with
log(
E
base
/
E
column
) remains linear and parallel with
that for
E
base
/E
soil
≥
10 (curves 2 & 3, 5 & 6 in
Figure 6a).
•
The rate of reduction of
r
towards the column tip,
represented by the
m
, has been found to increase
linearly with
E
base
/
E
column
. Curve 7 in Figure 6b
shows such relationship and is applicable for cases
with different
b
/a ratio up to 3 (limit of parametric
range) and with
E
base
/
E
soil
≥
10. Curves 8 and 9
delineate the corresponding curves for cases with
E
base
/
E
soil
= 2 and 1.
Figure 6. Stone column with compressible base -elastic solution
3.3
Stone columns on compressible soils - elasto-plasticity
The effect of compressible base on stress concentration
n
is now
discussed based on Mohr Coulomb model. In particular, the
soils surrounding and below the stone columns have been
appraised alternatively using (i) effective shear strength (c,
φ
)
and (ii) undrained shear strength s
u
.
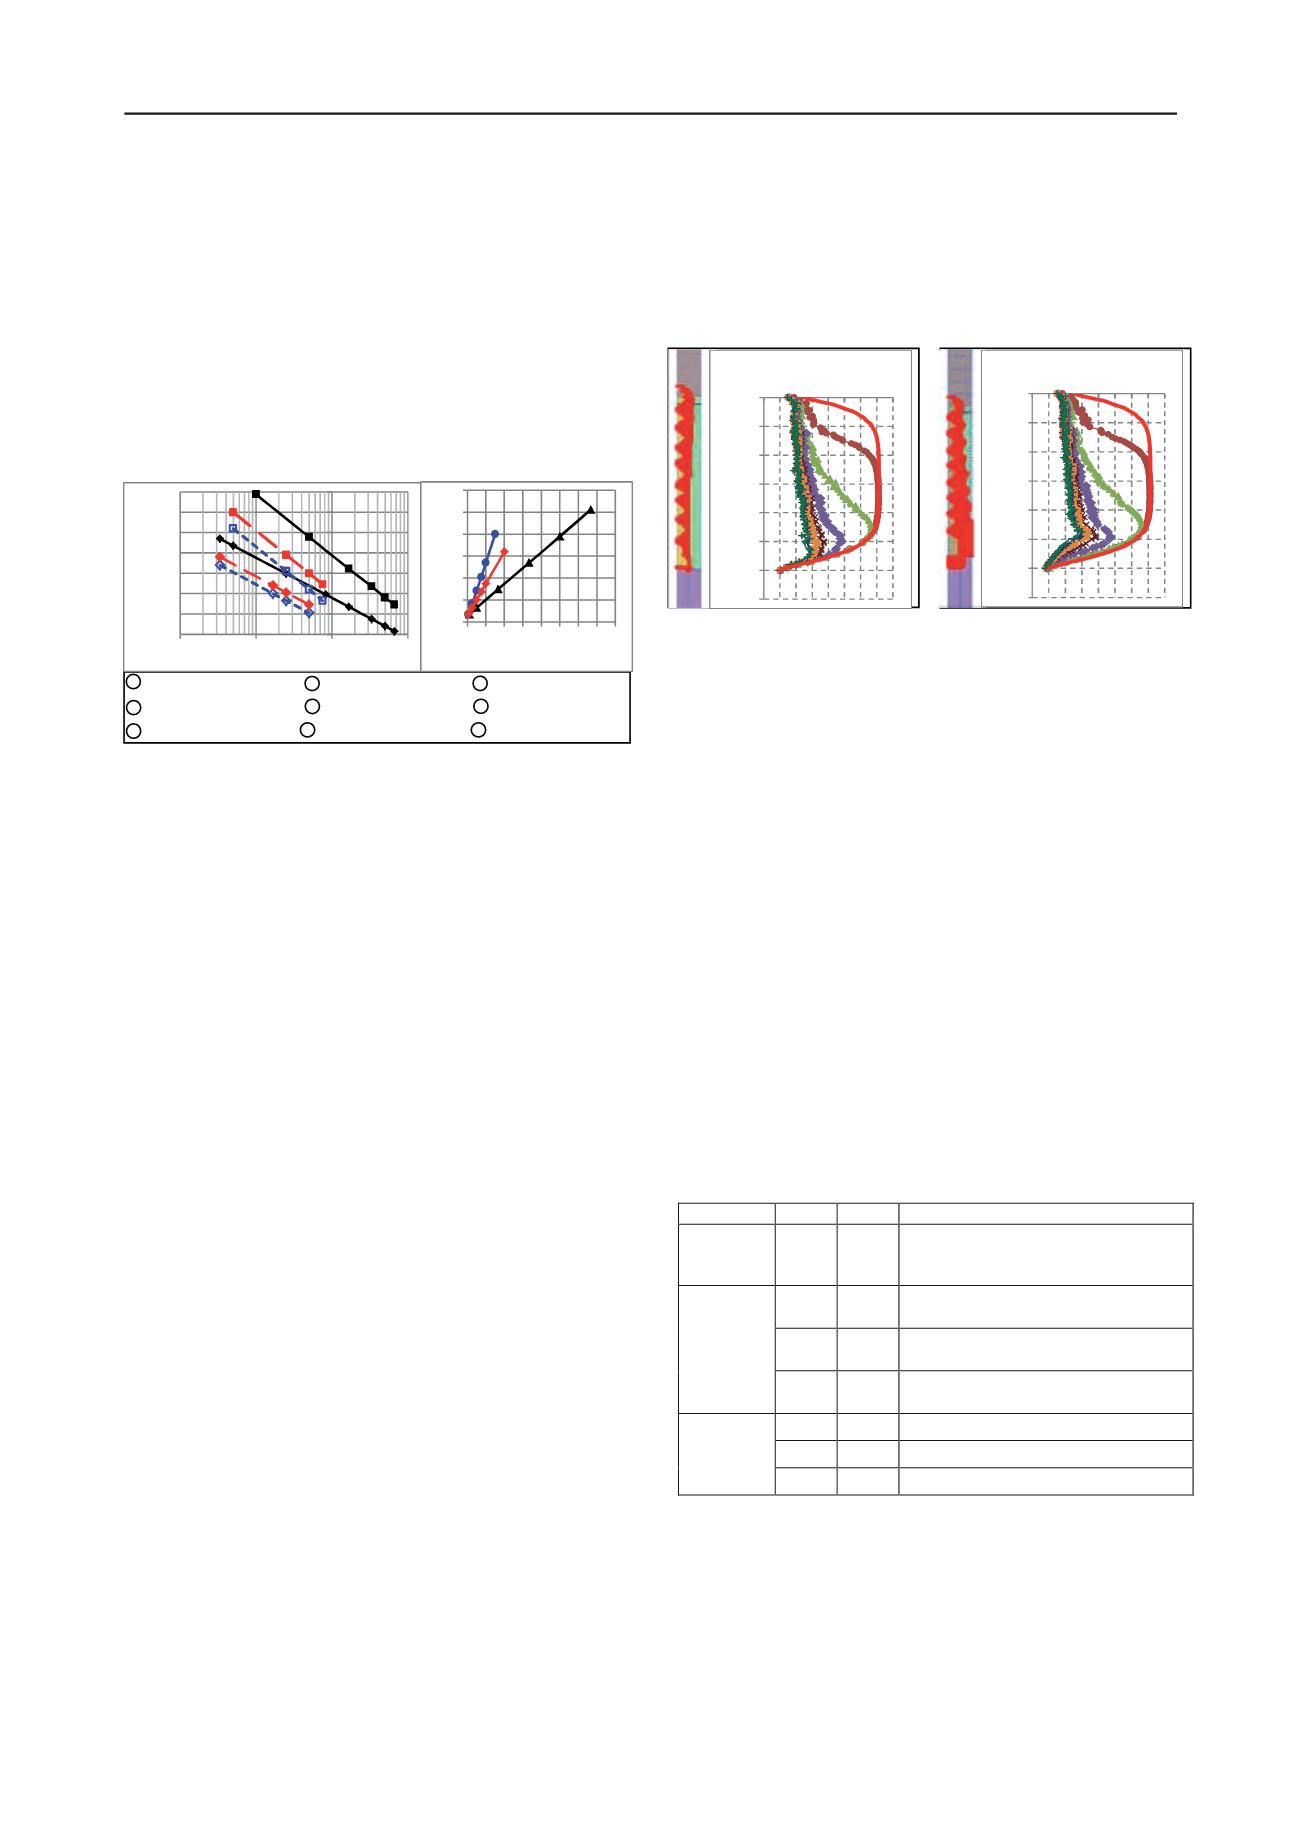
Figure 7a shows the computed
n
under different fill loads for
the same case as in Figure 2,except that the column is founded
on compressible soil that is represented by
c
-
φ
materials. The
stress concentration curves initially follow identical paths as
those shown in Figure 3b until they intercept the lower equal
settlement plane and thereafter trace along the curve of the
elastic solution at the column base. To explain this stress
transfer mechanism, the material stress state of the model at the
end of simulation (under 140kPa fill stress) is presented (inset
in Figure 7a). As before, yielding of the column follows a top-
down process. While there is significant yielding of the column
due to high stress ratio, there is little yield in the surrounding
soil especially towards the column base because of sufficient
confinement even with an adopted soil friction angle as low as
22°. Since the soil is elastic, the reduction of
n
due to the
compressible elastic base soil can be superimposed directly onto
the aforementioned reduction due to yielding of column.
Figure 7b presents the results for the case where s
u
= 30kPa
has been adopted for the soils surrounding and below the
column. Significant yielding occurs in the soils, which has
altered the shape of the stress concentration curves towards the
column base as compared to that of the c-
φ
soils. However the
differences are not great and for the purpose of assessing
n
, the
problem can be idealised by assuming that there is no failure in
the surrounding soil so that its behavior is essentially elastic.
3.4
Procedure for assessing stress concentration
The following procedure for assessing the stress concentration
of the stone columns under fill embankment may be proposed:
Step 1
– Assessing the stress concentration
n
along column
depth by using charts such as Figure 4, which have accounted
for the influence of load level, column spacing, modulus ratio of
column and surrounding soil, and yield of the stone column.
Step 2
– Assess the influence of the compressible base soil
on
n
based on elasticity by the following equation:
n
=
n
max
×
r
(4)
where
r
is the stress concentration reduction ratio given in Eq.
3, which is a function of
ξ
and
m
given in Figure 6.
n
max
is the
maximum elastic
n
value below the turning point of each
normalised
z·
γ
/q
a
−
n
curve in Figure 4.
Step 3
– Superimpose the solution from Step 2 onto that of
Step 1. Thereby, the final
n
along the depth of the column is the
lower of the two solutions at the same depth.
Figure 7. Stone column on compressible (a)
c
-
φ
and (b) s
u
soil
4 COMPARISON WITH FULL 3-D MODELLING
The accuracy of plane strain idealisation of stone columns using
equivalent strips in 2D FEA was investigated under self-weight
load imparted by a 6m high embankment with 2H:1V batter.
The analyses undertaken for the investigation include
:
Analysis
1
- Full 3D FEA of embankment over stone columns modeled
by solid elements;
Analysis 2
- Axisymmetric FEA of a unit cell
consisting stone column;
Analysis 3
- 2D plane strain FEA with
the stone columns modeled as strips; and
Analysis 4
- 2D FEA
with the soil and columns modeled as equivalent block. The 2D
and 3D FEA were carried out using software programme
PLAXIS 2D and PLAXIS 3D, respectively.
Table 1 summarises the adopted parameters for all analyses.
The 3D FEA is considered a baseline model that comprises a
13m long segment of embankment over soft clay treated with
stone columns which are founded on compressible soil. The
analysis was repeated with the 0.9m diameter stone columns
spaced at 1.7m, 2m and 2.5m in triangular pattern. The 3D FE
mesh is shown in Figure 8. The stone columns are modeled
using 15 nodes wedge element with interface elements at the
column-soil contact. Two cases of interface strength of 100%
and 67% of the surrounding soil strengths have been considered.
Table 1. FEA Model Parameters
Soil surrounding columns are E
soil
= 3MPa, c
soil
= 2kPa,
φ
soil
= 26º;
Soil beneath columns are E
base
= 3MPa, c
soil
= 5kPa,
φ
soil
= 28º
In Analysis 3, a 2D plane strain idealisation of the stone
columns using equivalent strips was investigated. The strips are
divided into several segments, each of which has different
strength properties that correspond to the varying stress
concentration along the column depth. The dimension and
spacing of the 2D strips are as per those outlined in Figure 1.
Analysis 4 presents a conventional 2D approach in which the
entire treated soil is represented by a single block with the
Analysis
b/d
a
r
Stone Column Parameters
1,2
3D FEA
2.0,
2.3,
2.9
0.26,
0.19,
0.12
E
col
=50MPa, c
col
=0kPa,
φ
col
= 40º
3 - 2D
FEA
(strips)
2.0
0.26
E
strip
=26MPa, c
strip
~1kPa,
φ
strip
= 36.5 -
38° along shaft , = 35.5 near base
2.3
0.19
E
strip
=22MPa, c
strip
~1kPa,
φ
strip
= 35.5º-
37° along shaft ; =34° near base
2.9
0.12
E
strip
=18MPa, c
strip
~1kPa,
φ
strip
= 34.5º-
35.5° along shaft; = 33° near base
4 - 2D
FEA
(equiv.
block)
2.0
0.26
E
block
=6MPa, c
block
~1kPa,
φ
block
= 30º
2.3
0.19
E
block
=6MPa, c
block
~1kPa,
φ
block
= 30º
2.9
0.12
E
block
=6MPa, c
block
~1kPa,
φ
block
= 30º
1
2
3
4
5
6
7
8
9
1
2
3
4
5
6
7
8
9
b
/
a
= 3,
E
base
/
E
soil
≥
10
b
/
a
= 2,
E
base
/
E
soil
≥
10
b
/
a
= 3,
E
base
/
E
soil
=2
b
/a = 3,
E
base
/
E
soil
=1
b
/
a
= 2,
E
base
/
E
soil
=2
b
/
a
= 2,
E
base
/
E
soil
=1
b
/a
≤
3,
E
base
/
E
soil
≥
10
b
/
a
≤
3,
E
base
/
E
soil
=2
b
/a
≤
3,
E
base
/
E
soil
=1
(a)
(b)
(a)
(b)
60kPa – 140kPa
40kPa
Fill
Load
20kPa
Elastic
solution
0.5
1.5
2.5
3.5
4.5
5.5
6.5
7.5
0.01
0.1
1
10
Influenced zone
ξ=
y/a
E
base
/E
column
0
10
20
30
40
50
60
0 1 2 3 4 5 6 7 8
m
E
base
/E
column
-14
-12
-10
-8
-6
-4
-2
0
0 2 4 6 8 10121416
Depth z below top of stone column (m)
Stress Concentration ratio
n
-14
-12
-10
-8
-6
-4
-2
0
0 2 4 6 8 10 12 14 16
Depth z below top of stone column (m)
Stress Concentration ratio
n


