2591
Technical Committee 211 /
Comité technique 211
breakage in the cement, while dilation involves particle
rearrangement that is only possible after bonding breakage.
Assuming only compressive volumetric deformations up to the
point of zero dilation, beyond this point yielding exists, which
indicates that the onset of cement breakage is progressive
starting even before peak. However, being the peak strength not
frictional but controlled by the cement yielding, then most
destructuration may take place only at peak.
Table 1.Moulding conditions of the specimens for the triaxial tests
Moulding
Point
%C
(%)
γ
d
(kN/m
3
)
e
0
w
(%)
n/C
iv
0.21
UCS
(kPa)
σ’
c
(kPa)
2
16.6 0.61 12
36
800 30
2
16.5 0.62 12
36
800 80
1
2
16.7 0.60 12
36
800 250
4
15.4 0.74 12
36
800 30
4
15.7 0.71 12
36
800 80
2
4
15.5 0.73 12
36
800 250
5
16.9 0.59 12
29
2000 30
5
17.0 0.58 12
29
2000 80
3
5
17.0 0.58 12
29
2000 250
7
16.3 0.66 12
29
2000 30
7
16.5 0.63 12
29
2000 80
4
7
16.7 0.61 12
29
2000 250
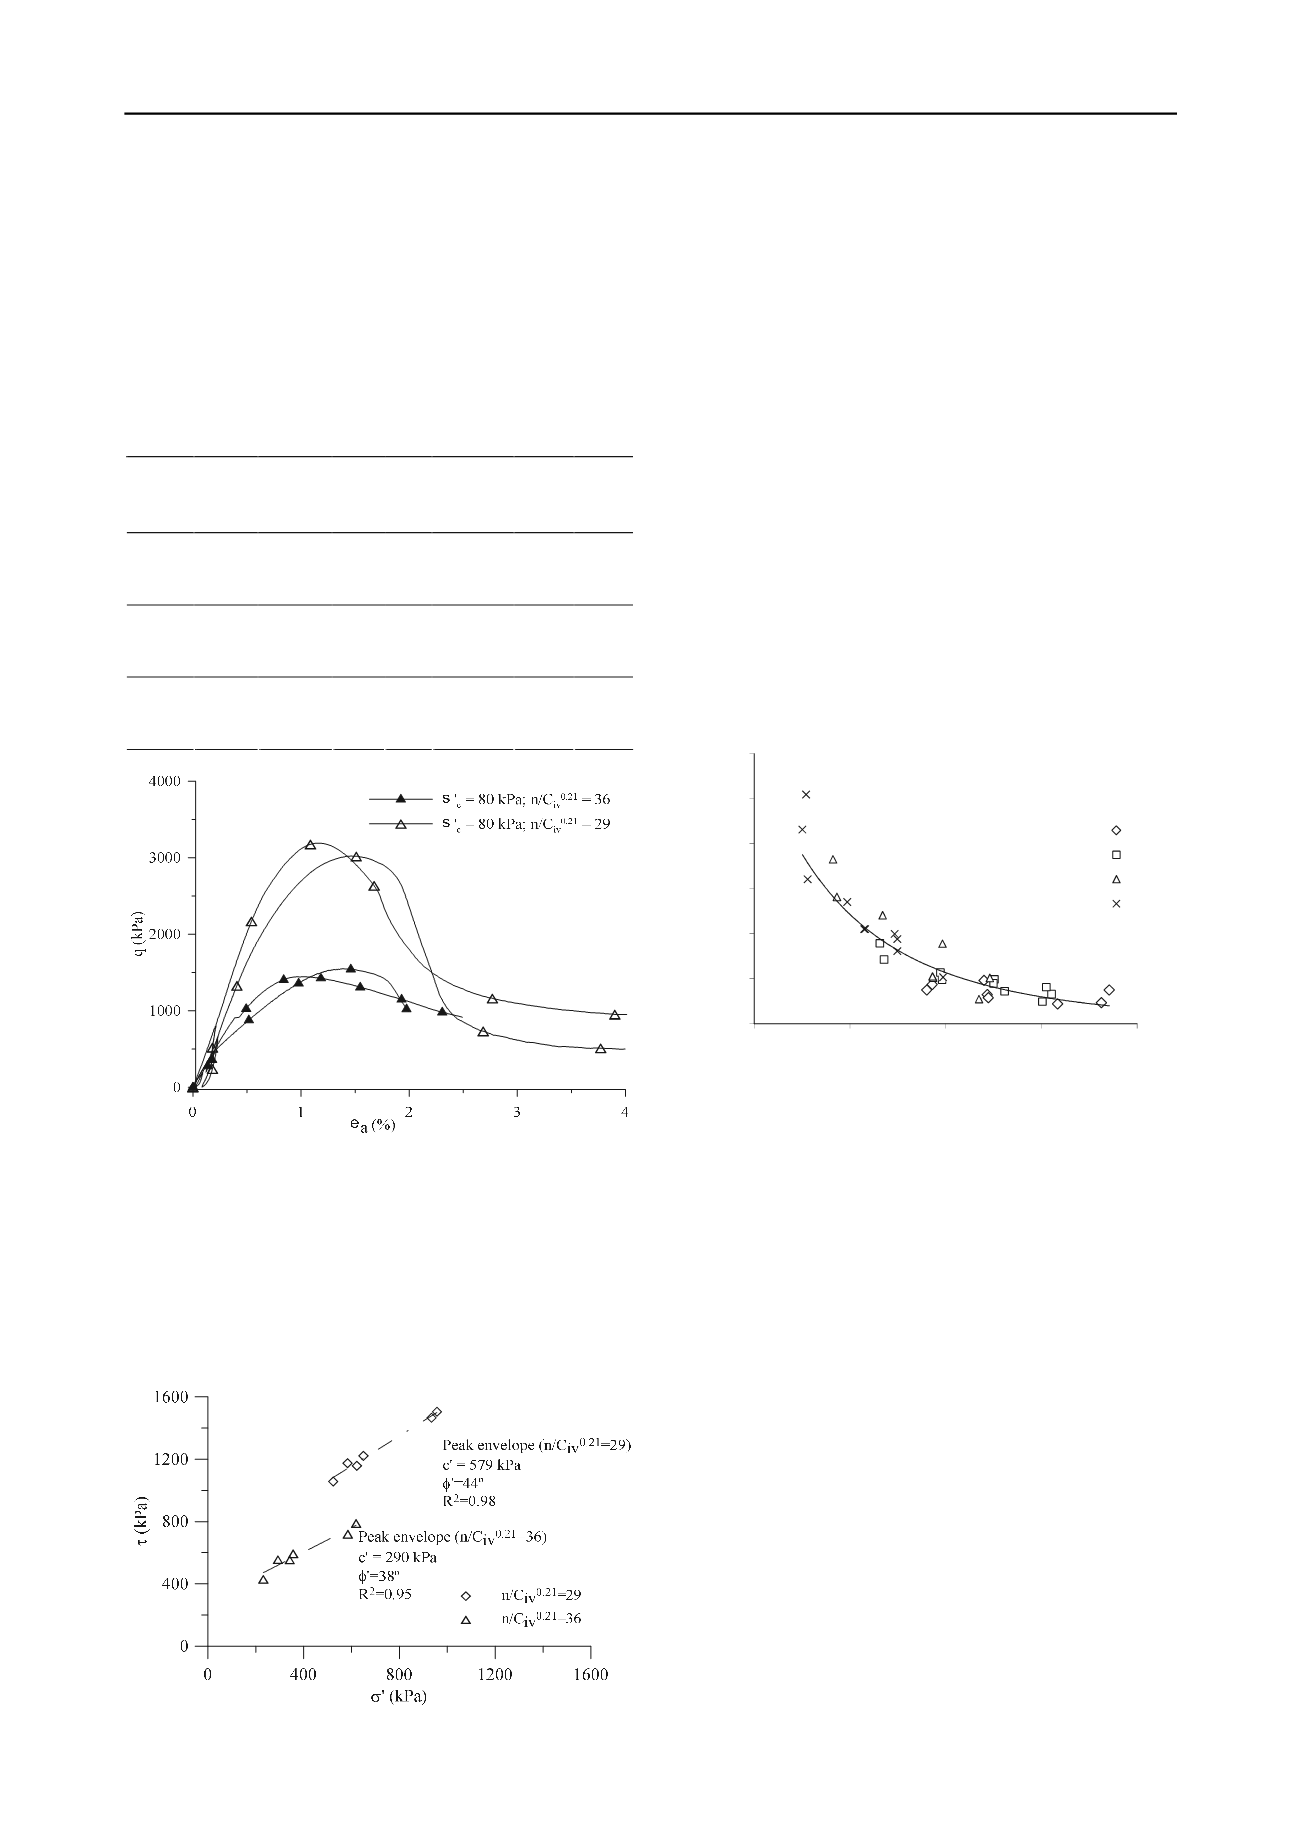
Figure 3. Stress-strain curves for the confining pressure of 80 kPa.
All the cemented specimens tested in triaxial tests suffered
strain localisation. Therefore, it becomes difficult to rely on the
local instrumentation at strain levels close and after the peak,
but especially at ultimate conditions. In that sense, the stress
invariants such as the deviator stress (q) and the mean effective
stress (p’) were not considered representative of the stress state
and thus, the stresses acting on the shear plane were calculated
by the procedure used by Gasparre (2005) based on the Mohr
circles and taking into account the post rupture analysis
described by Burland (1990).
Figure 4.Peak strength envelopes by adjusted porosity/cement ratio.
In Figure 4 the stresses acting on the plane are plotted on a
(σ’,
) graph for peak conditions from which the correspondent
strength parameters were obtained. The points are assigned to
each adjusted porosity/cement ratio (n/C
iv
0.21
) expressed before.
It is interesting to notice that for peak conditions two strength
envelopes were obtained depending on the index ratio. The
adjusted porosity/cement ratio influences the peak angle of
friction and cohesion intercept, being the peak envelope for the
index n/C
iv
0.21
=29 higher than that for the index equal to 36.
This could have been predicted from moulding characteristics as
each ratio corresponds to different UCS.
4 STIFFNESS PARAMETERS
4.1 Initial tangent stiffness
The unconfined compression tests were performed with local
measurement of deformation using LDT’s an
d so the stiffness
modulus could be evaluated. An initial tangent modulus (E
ti
)
was then calculated based on the linear part of the stress-strain
curve.
Plotting this modulus against the adjusted
porosity/cement ratio for the 16 tests presented above, as
Figure 5 shows, it can be concluded that the general adjustment
of the data is quite reasonable.
E
ti
= 2E+09 (n/C
iv
0.21
)
-4.169
R² = 0.85
0
1000
2000
3000
4000
5000
6000
20
25
30
35
40
E
ti
(MPa)
n/C
iv
0.21
2%C
3%C
5%C
7%C
Figure 5. Indirect tensile strength and unconfined compression strength
against the adjusted porosity/cement ratio
As expected, stiffness parameters are more scattered than
strength parameters because strain measurements are always
more sensitive to non-homogeneities of the specimen and
anchors are introduced in the specimen in single reference
points. On the contrary, strength measurements capture more
easily an average value of the whole specimen.
4.2 Unload-reload moduli
In the triaxial compression tests reported above, a small
static cycle was performed during shearing, between 30% and
15% of the expected peak deviatoric stress. These loads were
selected to avoid soil yielding before the cycles so the modulus
could be assumed elastic. Figure 6 summarizes the results of the
unload-reload moduli (E
ur
) obtained for the two adjusted
porosity/cement ratio. The values of E
ur
obtained from these
triaxial tests are higher than the initial tangent modulus (E
ti
)
obtained in the unconfined compression tests presented in
Figure 5. This can be considered expected because E
ur
is usually
assumed to follow an elastic pattern, if performed at low ranges
of cyclic stress, while in the initial monotonic loading path
some compliance errors of strain gauges may be presented. This
graph also evidences a clear and almost discrete increase in the
stiffness modulus values for the specimens with n/C
iv
0.21
=29
(5% and 7% cement contents) in comparison with the
specimens with distinct ratio n/C
iv
0.21
=36 (2% and 4% cement
contents). This could be even clearer if the instrumentation


