2590
Proceedings of the 18
th
International Conference on Soil Mechanics and Geotechnical Engineering, Paris 2013
although a low plasticity index was obtained (I
P
=w
L
-w
P
=34%-
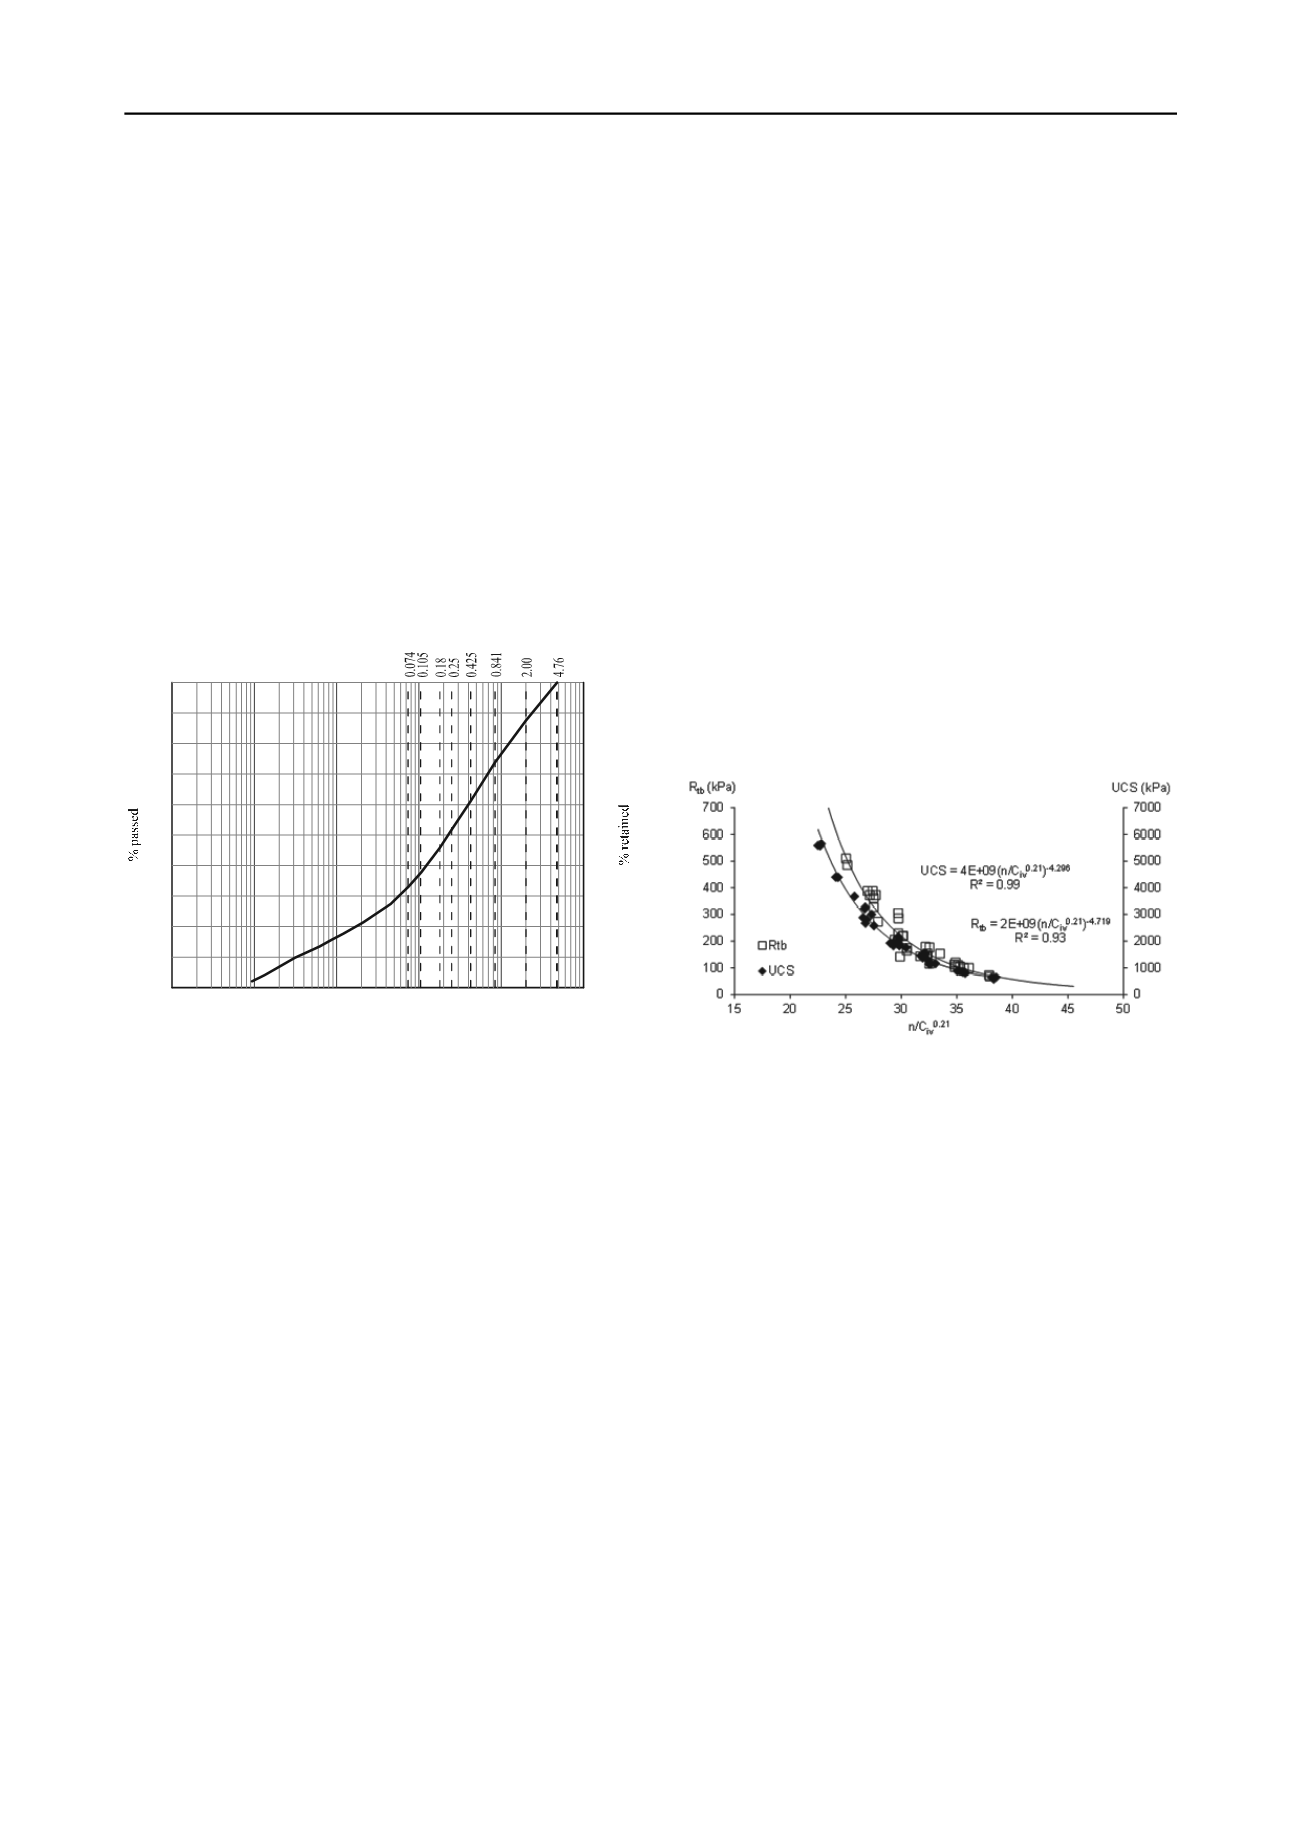
31%=3%). From the particle size distribution curve presented in
Figure 1 an average diameter D
50
equal to 0.25 mm was
obtained, as well as uniformity and curvature coefficients of 113
and 2.7 respectively.A high strength Portland cement (CEM I
52,5R) of grain density equal to 3.15 was used as the cementing
agent in order to speed up the laboratory tests.
The experimental program is performed with specimens
made by the mixture of silty sand, Portland cement and tap
water that is compacted statically in three layers in a stainless
steel mould. For each specimen, a quantity of fines equal to the
weight of cement to be introduced was removed from the soil,
in order to have the same grain size distribution curve in the
mixture of soil-cement as in the soil itself. Following this
procedure the dry density of the soil was also constant
throughout the study even though the cement content changed.
The specific gravity of the cement-soil mixture was calculated
as a weighted average of those of the soil (Gs=2.72) and of the
cement (Gs=3.15), and thus it was different for different cement
contents.
0.0001
0.001
0.01
0.1
1
10
Grain size (mm)
0
10
20
30
40
50
60
70
80
90
100
100
90
80
70
60
50
40
30
20
10
0
ASTM sieves series (mm)
Figure 1. Grain size distribution curve
3 STRENGTH PARAMETERS
3.1 Unconfined compression strength
Strength properties of the cemented sand were evaluated in
different ways by means of unconfined compression tests,
indirect tensile tests, as well as triaxial tests. First, several
specimens moulded to have different cement contents (2%, 3%,
5% and 7%) and dry unit weights (16.4, 17.2, 18.0 and
18.8 kN/m
3
) were tested in unconfined compression in a total of
16 tests. In these tests, the water content was kept equal to 12%.
The representation of the unconfined compression strength
(UCS) and the ratio of porosity to the volumetric cement
content (n/C
iv
) revealed that some adjustment was needed and
therefore, an exponent was added to C
iv
. This exponent was
defined as the value that provides the best correlation
coefficient with the data, which, for this material, was found to
be 0.21
–
Eq. (1).
UCS (kPa) = 4E+09 (n/C
iv
0.21
)
-4.296
(1)
This exponent seems to depend on the type of soil as other
authors have found different coefficients when working with
different soils (Consoli et al., 2007, 2011): an exponent of 0.28
was found in a residual soil from sandstone (Botucatu soil),
while a value of 1.0 was found in an uniform sand (Osorio
sand). Based on this parameter, named adjusted porosity/cement
ratio (n/C
iv
0.21
), the results of different tests were analysed.
1.1
Tensile strength
Taking into account the possibility of shrinkage in cemented
materials, the evaluation of the tensile strength is of utmost
importance. In that sense, indirect tensile tests following the
standard EN 13286-42 (CEN, 2003) were performed on similar
specimens whose results were plotted against n/C
iv
0.21
for which
Eq. (2) was obtained,
R
tb
(kPa) = 2E+09 (n/C
iv
0.21
)
-4.719
(2)
The results showed that the indirect tensile strength (R
tb
) was
about 11% of the UCS. In Figure 2 both R
tb
and UCS are
plotted against n/C
iv
0.21
in different scales for comparison. It is
clear that both trends are very similar (except for the absolute
values) corroborating the convenience of the adjusted
porosity/cement ratio.
In Consoli et al. (2011), where the data from these tests is
plotted together with data from other two soils, it is shown that
for the three soils a decrease in porosity promotes an increase in
the tensile strength as a consequence of the higher number of
contact points between particles which improves the
cementation. Also for the other two soils, a unique correlation
was found between the adjusted porosity/cement ratio and the
indirect tensile strength, the exponent of the ratio depending on
the soil.
Figure 2. Indirect tensile strength and unconfined compression strength
against the adjusted porosity/cement ratio
3.2 Triaxial tests
Drained triaxial compression tests were performed over soil-
cement specimens, which were moulded to have two different
adjusted porosity/cement ratios (n/C
iv
0.21
=36 and 29)
corresponding respectively to UCS of 800 kPa and 2000 kPa.
For these ratios, two moulding conditions were defined
characterized by cement content and dry unit weight while the
water content remains constant and equal to 12%. For the first
ratio (n/C
iv
0.21
= 36), 2 and 4% cement contents were considered
which lead to dry unit weights of 16.7 and 15.4 kN/m
3
,
respectively. For the second ratio (n/C
iv
0.21
= 29) higher strength
was needed, so 5 and 7% of cement contents were assumed with
17.0 and 16.4 kN/m
3
of dry unit weight. The tests were
performed at three different effective confining pressures (30,
80 and 250 kPa) over specimens moulded in four moulding
points, comprising 12 tests (Table 1).
The stress-strain curves (see Figure 3 as an example) clearly
evidence that the specimens with n/C
iv
0.21
=29 have higher peak
deviator stresses than the specimens with n/C
iv
0.21
=36
independently of the cement content. Adding cement to the sand
had the effect of increasing the shear strength by up to five
times for the adjusted porosity/cement ratio of 36 and tenfold
for the adjusted porosity/cement ratio of 29.All specimens
initially compressed, followed by significant dilation, which
was associated to a peak strength, before strain softening. This
is typical of cemented soils, with the maximum rate of dilation
taking place right after the peak strength (Viana da Fonseca
1998). The peak strength corresponds to the onset of significant


