2574
Proceedings of the 18
th
International Conference on Soil Mechanics and Geotechnical Engineering, Paris 2013
Settlement
gauge (G1)
60 kPa
10 m
1 m
20 m
PVD
Intact zone
Smearzone
0 m
Clayey
silt/Silty
clay
(CL/ML)
Silty
sand
7m
10m
1m
Sand bags
9m
3.0m
C
L
G1
PVDs
Surcharge Material
γ
t
=20 kN/m
3
LL=45
PI=18
Gs=2.74
G2
4m
0
1
2
3
4
0 10 20 30 40 50 60 70 80 90
EmbankmentHeight (m)
Time (days)
Commencementof recording
settlement plate readings
inaccurate predictions of the ground behaviour. This can lead to
early removal of surcharge in construction process resulting in
excessive post construction settlement. Therefore, it is essential
to study the influence of the uncertainties in the smear zone size
and its permeability on the preloading design to improve the
performance of soft deposits. Thus, a numerical code using
FLAC 2D has been developed in this study to investigate the
uncertainties of PVD smear zone characteristics on the
preloading design which can be used to back calculate smear
zone characteristics for actual preloading projects.
2 NUMERICAL MODELLING
In the present study, FLAC 2D v6.0 has been employed to
model the PVD assisted preloading process focusing on smear
zone uncertainties. Required new subroutines have been written
using the built-in programming language FISH (FLACish) to
tailor analyses to suit specific needs for the parametric study,
giving the following unique advantages to the developed code
for this study; (i) automatic mesh generation process by entering
the required parameters to modify the grid pattern inside and
outside the smear zone; (ii) ability to change different
parameters such as the model dimensions, vertical drain
properties, subsoil profile, smear zone characteristics and
preloading conditions; (iii) the option to define the exact
location of desired points to generate and plot any future history
graphs; and (iv) automatic solving process based on the
modified input data. Chittagong Sea Port in Bangladesh with
3.0 m high embankment on 9 m deep soft clay, has been
selected for the numerical simulations and verification of the
developed code and subroutines.
2.1.
Case Study: Chittagong Sea Port in Bangladesh
According to Dhar et al. (2011), a container yard has been
constructed at Chittagong Port, the largest sea port in
Bangladesh, for handling loaded containers. The site is located
on the bank of Karnafully river beside the Bay of Bengal in the
Indian Ocean. The yard covers an area of 60,700 m
2
and was
designed to support a container load producing a contact
pressure of approximately 56 kPa. Geotechnical investigations
revealed the presence of a soft to very soft clayey silt/silty clay
deposit with a thickness of approximately 7 m (Figure 3).
Preloading with prefabricated vertical drains was adopted to
preconsolidate the compressible soft deposits, which was
followed by the field monitoring. Vertical drains were installed
down to the depth of approximately 9 m below the ground level
in square patter to cover the full depth of the soft clay. A
surcharge load consisting of 3.0 m high fill of sand was placed
for preloading. Surcharge material was placed in two layers of
approximately equal thickness. The sides of the surcharge load
were kept vertical along the boundaries of the area using sand
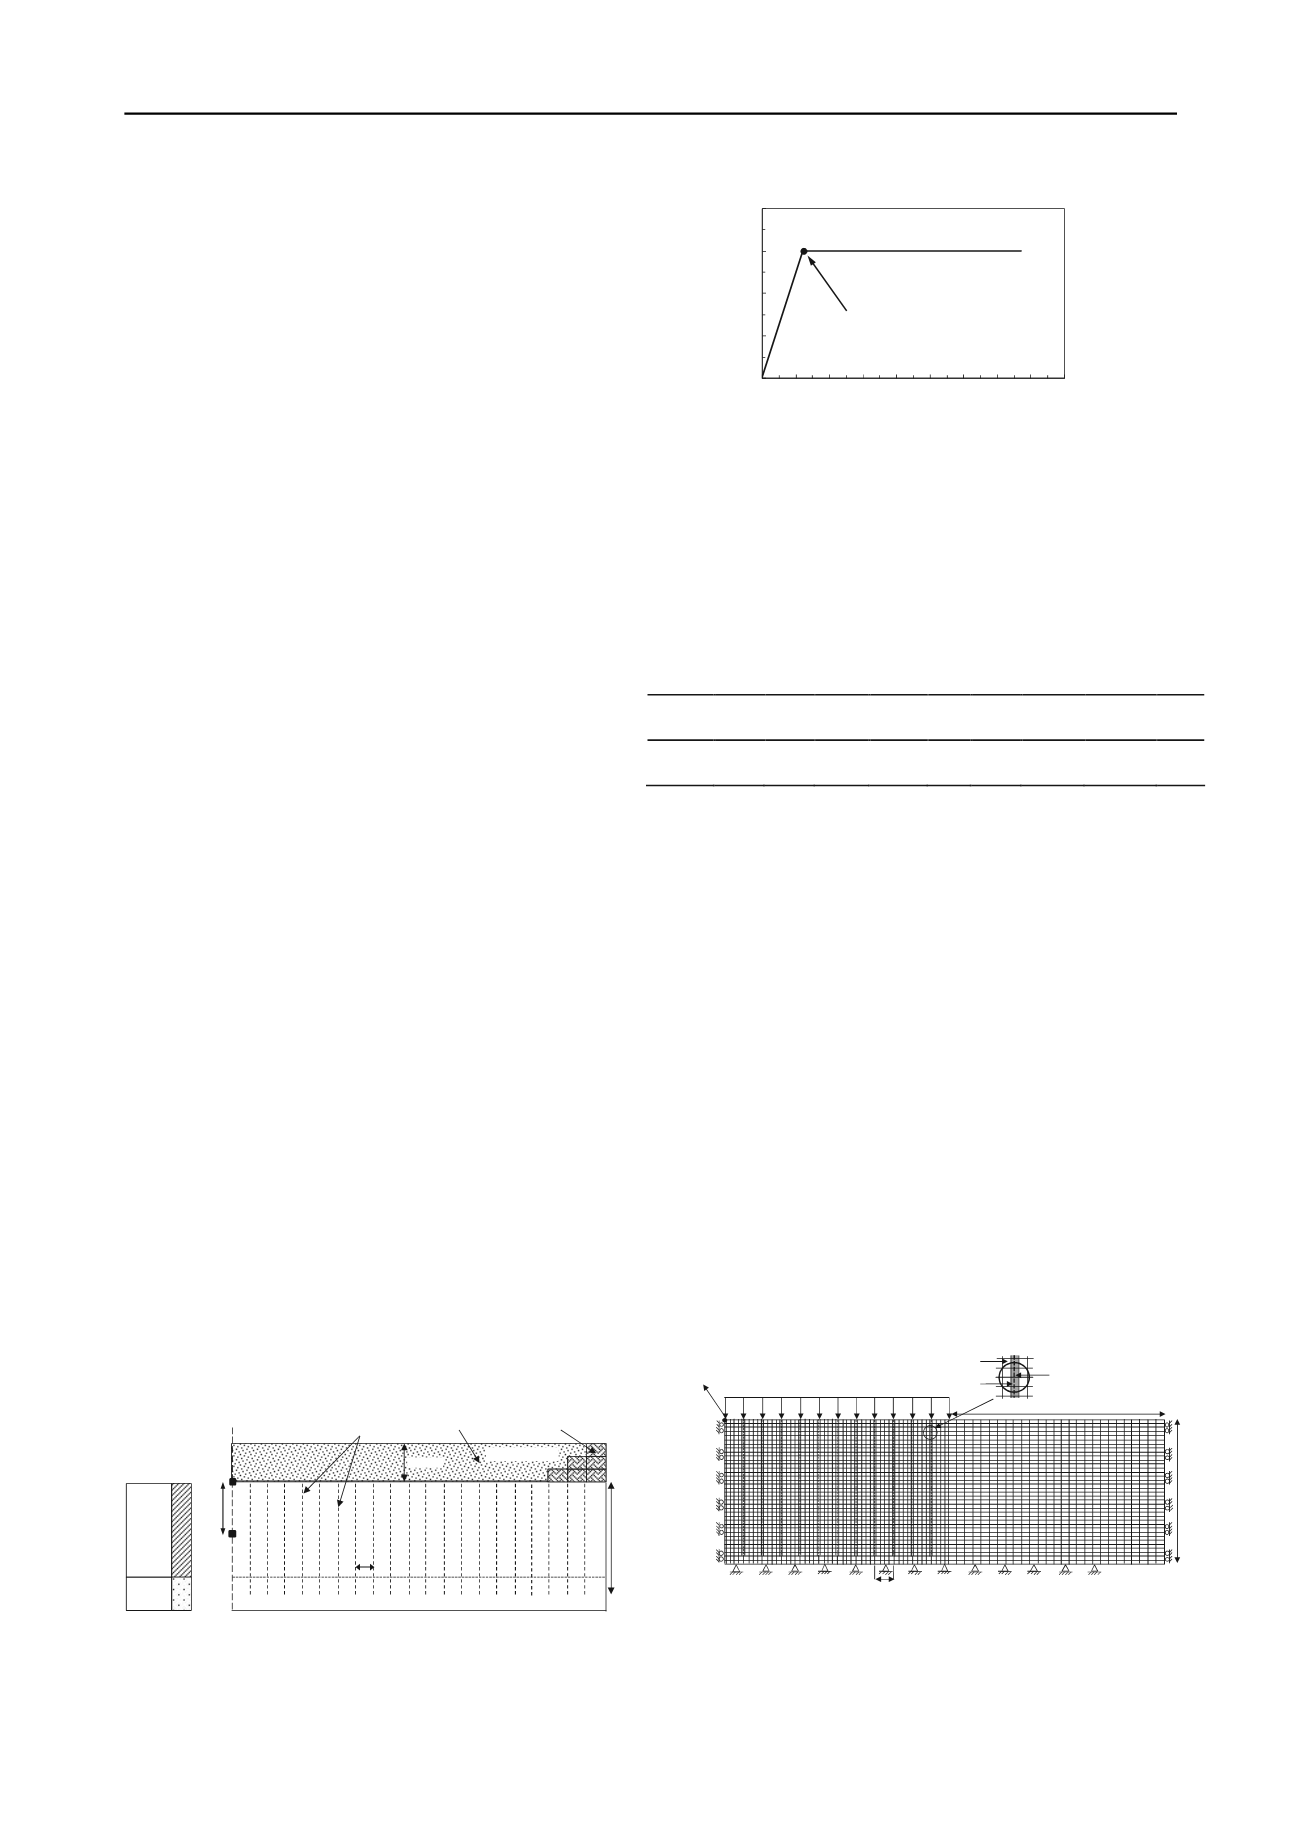
bags and brick stacks. Figure 3 shows a profile detailing the
ground improvement work schematically. In addition, Figure 4
shows the construction history of the embankment.
Figure 3. Cross section of constructed embankment
Figure 4. Construction history (Chittagong Port embankment)
FLAC 2D numerical code incorporating modified Cam-Clay
constitutive soil model has been employed to simulate
Chittagong Port preloading process applying plane strain
conditions. The zero excess pore water pressure has been
considered along the vertical drains and the ground surface
boundary to model the PVD and surface drainage, respectively.
Adopted soil properties in the numerical analysis are
summerised in Table 1.
Table 1. Adopted soil properties (after Dhar et al. 2011)
Layer
Soil
type
M
λ
κ
ν
e
○
γ
s
kN/m
3
k
h
10
-9
m/s
k
h
/
k
v
Clayey
Silt
Soft
soil
0.94 0.13 0.026 0.3 1.28 14.0
2.31 1.5
The equivalent plane-strain permeability (k
hp
) proposed by
Indraratna and Redana (2000) has been used in the numerical
analysis.
(
k
hp
/k
h
)
= 0.67
/ [(ln(
n
)
-0.75
]
(1)
(
k
sp
/k
hp
)
=
β
/ [(
k
hp
/k
h
) [(ln(
n
/
s
)
+
(
k
h
/k
s
) ln(
s
)-
0.75
]-
α]
(2)
α
=
2
(
n
-
s
)
3
/ [3(
n
-
1
)
n
2
]
(3)
β
= [
2
(
s
-
1
) / (
n-1
)
n
2
] * [
n
(
n
-
s
-
1
) +
1
/
3
(
s
2
+
s
+
1
)]
(4)
where,
k
h
and
k
hp
are axisymmetric and plane-strain horizontal
permeability values of intact zone respectively,
k
s
and
k
sp
are
axisymmetric and plane-strain permeability values of smear
zone, respectively,
α
and
β
are geometric coefficients,
n
is the
spacing ratio equal to
B/b
w
where
B
and
b
w
are equivalent plane-
strain radius of the influence zone and radius of the drain
respectively, and
s=r
s
/r
w
. The value of
k
h
needs to be
determined first (laboratory or field), then
k
hp
can be calculated
using Equation (1). When
k
hp
is known,
k
sp
can be obtained
from Equation (2). The discretised plane- strain finite-difference
mesh composed of quadrilateral elements is shown in Figure 5,
where only half of the trial embankment is considered by
exploiting symmetry.
Figure 5. Sample of mesh grid pattern for Chittagong Port embankment
considering the smear
Numerical results are compared with the field measurements in
Figure 6. According to Figure 6, FLAC predictions are in a
good agreement with the field measurements considering
k
h
/k
s
=2 and r
s
/r
m
=3. The primary consolidation settlement is


