2570
Proceedings of the 18
th
International Conference on Soil Mechanics and Geotechnical Engineering, Paris 2013
Table 1. Bleed capacity values (%) of all cement grouts
W/C
dmax
0.6
0.8
1.0
2.0
3.0
100μm
5-10
17-19
16-39
44-60
60-70
40μm
5-7
11-15
10-26
42-55
56-68
20μm
N/T
N/T
0-4
25-37
43-49
10μm
N/T
N/T
0-2
7-26
38-42
N/T: Not tested
the total amount of cement, 70 % of the water and the
superplasticizer dosage were mixed for 5 min. Then, the rest of
the water was added and mixing continued for another 5 min.
Bleed capacity measurements were conducted for all cement
suspensions used and the results are summarized in Table 1.
According to Standard EN 12715, a suspension is stable
when it has a bleed capacity of not more than 5 % after 120 min
from preparation. It can be observed that a W/C ratio of about
0.6 was required to obtain stable suspension of the coarse
cements (d
max
=100μm and 40μm)
while microfine cement
suspensions were stable for a W/C ratio of 1.0
The soils used were clean, uniform, limestone sands with
angular grains and were grouted at a dense (relative density
approximately 90%) and dry state. Two different sand
gradations were used with grain sizes limited between sieve
sizes (ASTM E11) Nos. 10-14 and 14-25 (d
15
size of 1.5mm
and 0.8mm, respectively) in order to allow grouting by both the
coarse- and fine-grained suspensions. The angle of internal
friction of the sands was 42.2
°
and 42.6
°,
respectively.
Laboratory equipment, similar to the arrangement described
in ASTM D4320-84, was used to produce small-size grouted
sand specimens, with a height of 112mm and a diameter of
50mm, ready for testing (Pantazopoulos et al. 2012). Injection
was stopped when the volume of the injected grout was equal to
two void volumes of the sand in the molds. After 24 h, the
specimens were extracted from the split molds and cured in a
humid room for 28 days before testing.
Grouted specimens were tested in unconfined compression at
a displacement rate equal to 0.1%/min. Hydraulic conductivity
tests were performed according to the procedure described by
Head (1986) for permeability testing in a triaxial cell with two
back-pressure systems. Drained triaxial compression tests were
conducted under confining pressures of 100, 200 and 400kPa
and axial strain rate equal to 0.1%/min, without initial saturation
and consolidation.
The dynamic properties of the grouted sands
were investigated at confining pressures up to 400kPa by
conducting torsional resonant column tests for a shear strain
range, γ, of approximately 5*10
-5
% to 5*10
-2
%. Testing
procedures and interpretation of raw data complied with well
established methods (Pantazopoulos and Atmatzidis 2012). For
comparison, similar tests were conducted on clean sands.
3
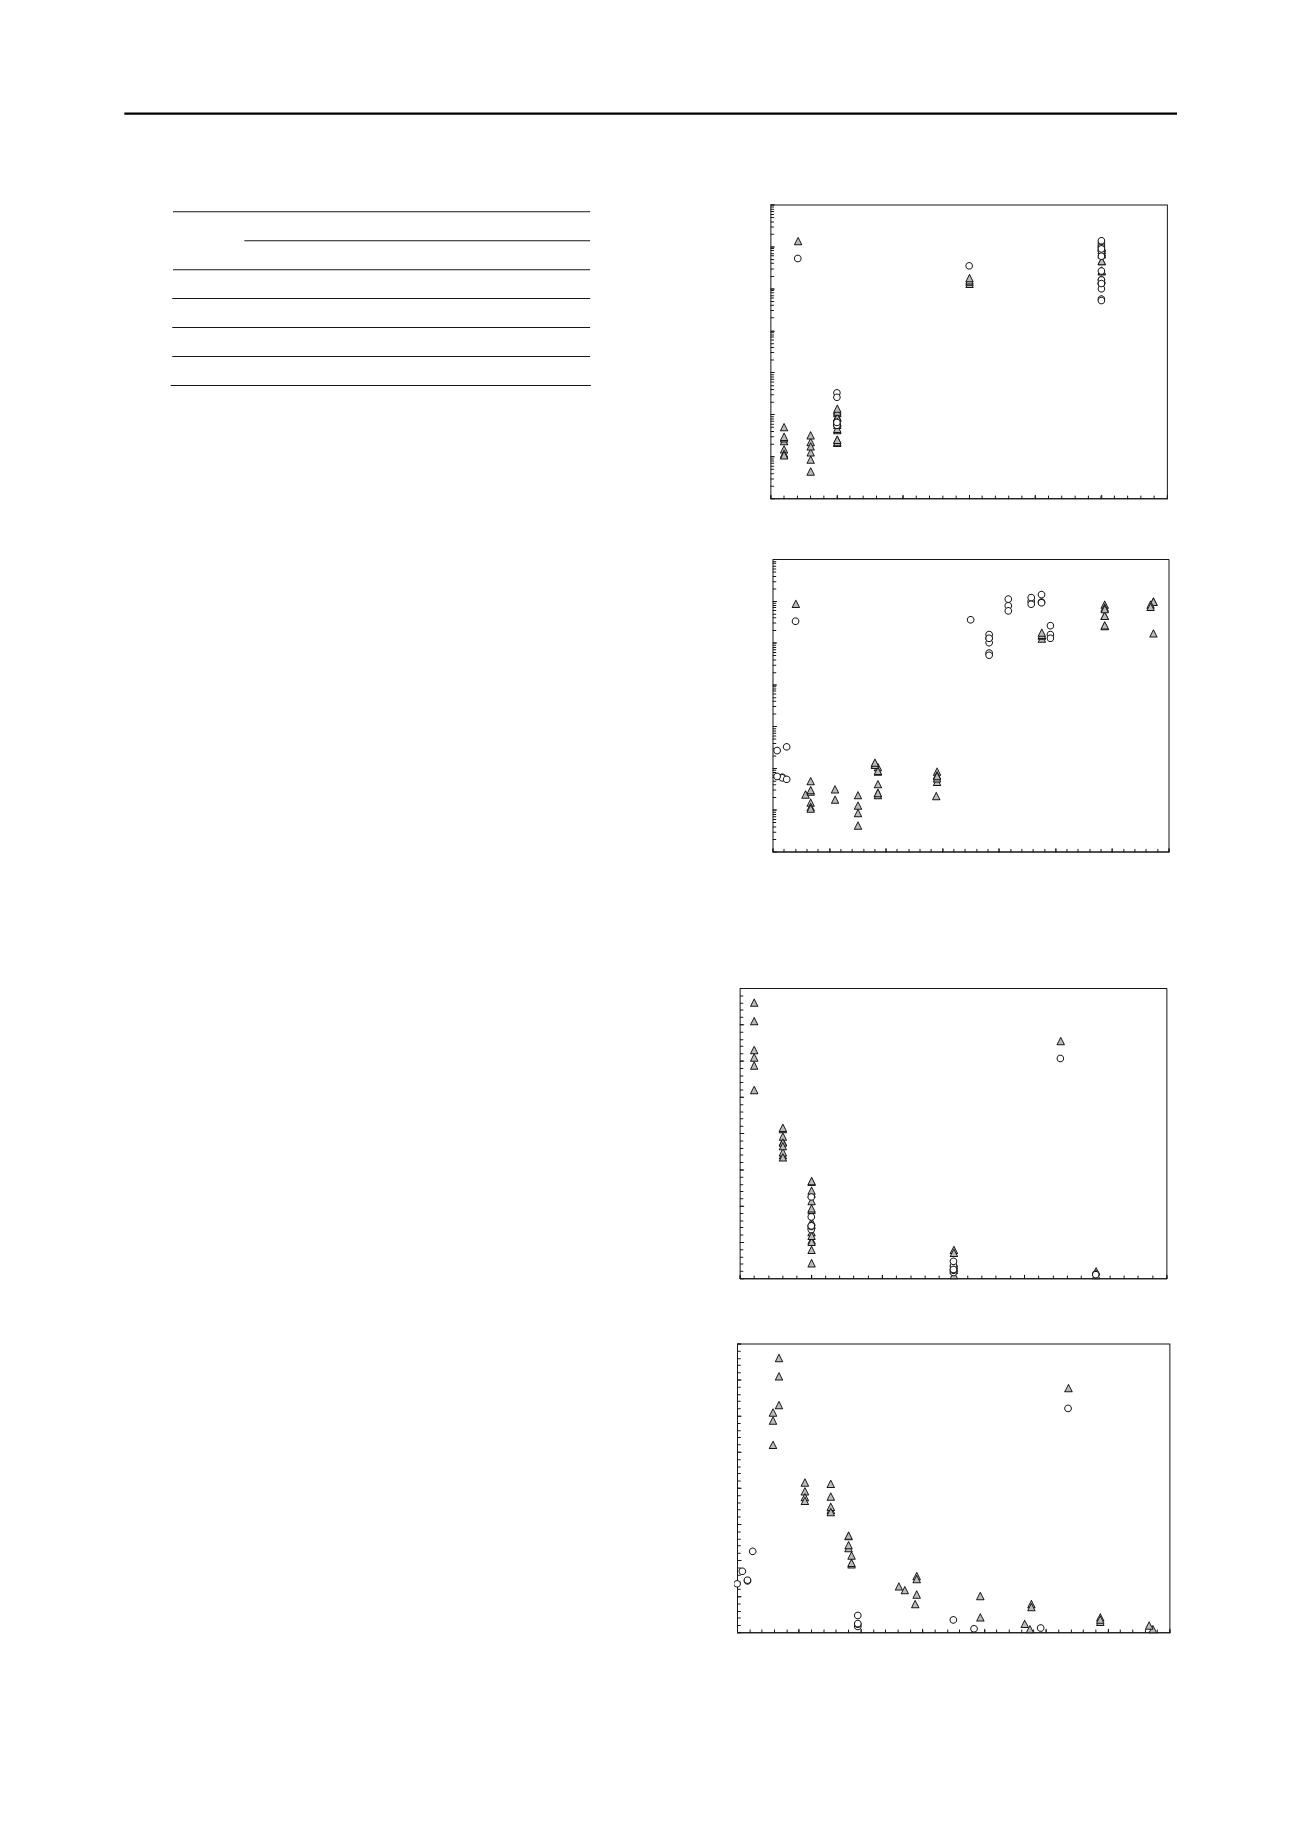
COEFFICIENT OF PERMEABILITY
The coefficient of permeability values of all grouted sands
tested are presented in Figure 2 with respect to W/C ratio, bleed
capacity and maximum cement grain size of the suspensions.
The coefficient of permeability decreases considerably (by
about 5 orders of magnitude) as the W/C ratio decreases from 3
to 0.6 and attains a value of about 10
-7
to10
-8
cm/s indicating
practically impermeable materials. The permeability of the
grouted sands appears not to be affected by the cement grain
size. Evaluation of the permeability of the grouted sands in
terms of grout bleed capacity indicates a similar trend as with
the W/C, but allows some observations to be made in terms of
the effect of cement grain size. For cement grouts with d
max
equal to 100μm and 40μm, the coefficient of permeability of the
grouted sands attained values in the range of 10
-7
to 10
-8
cm/s
and 10
-3
to 10
-4
cm/s, for grout bleed capacity ranging from 6%
1.00E-09
1.00E-08
1.00E-07
1.00E-06
1.00E-05
1.00E-04
1.00E-03
1.00E-02
0.5
1
1.5
2
2.5
3
3.5
Water-to-cement ratio, W/C
Coefficient of permeability, k
20
(cm/s)
100μm - 40μm
20μm - 10μm
d
max
1.00E-09
1.00E-08
1.00E-07
1.00E-06
1.00E-05
1.00E-04
1.00E-03
1.00E-02
0
10
20
30
40
50
60
7
Bleed capacity (%)
Coefficient of permeability, k
20
(cm/s)
0
100μm - 40μm
20μm - 10μm
d
max
Figure 2. Effect of grout W/C ratio and bleed capacity on the
permeability of cement grouted sands.
0
5
10
15
20
25
30
35
40
0.5
1
1.5
2
2.5
3
3.5
Water-to-cement ratio, W/C
Unconfined compr. strength, q
u
(MPa)
100μm - 40μm
20μm - 10μm
d
max
0
5
10
15
20
25
30
35
40
0
10
20
30
40
50
60
7
Bleed capacity (%)
Unconfined compr. strength, q
u
(MPa)
0
100μm - 40μm
20μm - 10μm
d
max
Figure 3. Effect of grout W/C ratio and bleed capacity on the
unconfined compression strength of cement grouted sands.


