2571
Technical Committee 211 /
Comité technique 211
to 30% and from 48% to 68%, respectively. Sands injected with
microfine cement grouts (d
max
=20μm and 10μm) obtained,
generally, higher coefficients of permeability, by half to one
order of magnitude, compared to sands grouted with the coarser
cement suspensions, for similar bleed capacities. This is
reasonable and can be attributed to the increased amount of
coarse-grained cement needed to obtain the same bleed capacity
with suspensions of microfine cements. It should also be noted
that (a) similar coefficient of permeability values (10
-7
to 10
-8
cm/s) are obtained when injecting with stable or unstable
suspensions for bleed capacity values up to 30% and (b) for
higher bleed capacity values, the coefficient of permeability of
the grouted sand decreases dramatically but remains in the
range of 10
-4
to 10
-3
cm/s.
4
UNCONFINED COMPRESSION STRENGTH
The results presented in Figure 3 indicate that the unconfined
compression strength of the grouted sands increases
significantly with decreasing W/C ratio of the grouts, as verified
by other research efforts (i.e. Dano et al. 2004) and seems not to
affected by cement grain size. However, the effect of cement
grain size can be clearly demonstrated in terms of grout bleed
capacity. The unconfined compression strength of the grouted
sands is very well correlated with grout bleed capacity of both
the coarse-grained cements (d
max
=100 and 40μm) and the
microfine cements (d
max
=20 and 10μm) but, definitely,
microfine cement grouts with the same bleed capacity as cement
grouts yield significantly lower grouted sand strength. As with
permeability, this can be attributed to the increased amount of
coarse-grained cement needed to obtain the same bleed capacity
as microfine cement suspensions.
5
SHEAR STRENGTH
The shear strength of the grouted sand specimens is expressed
in terms of internal friction angle and cohesion, by applying the
Mohr-Coulomb failure criterion. As indicated in Figure 4, the
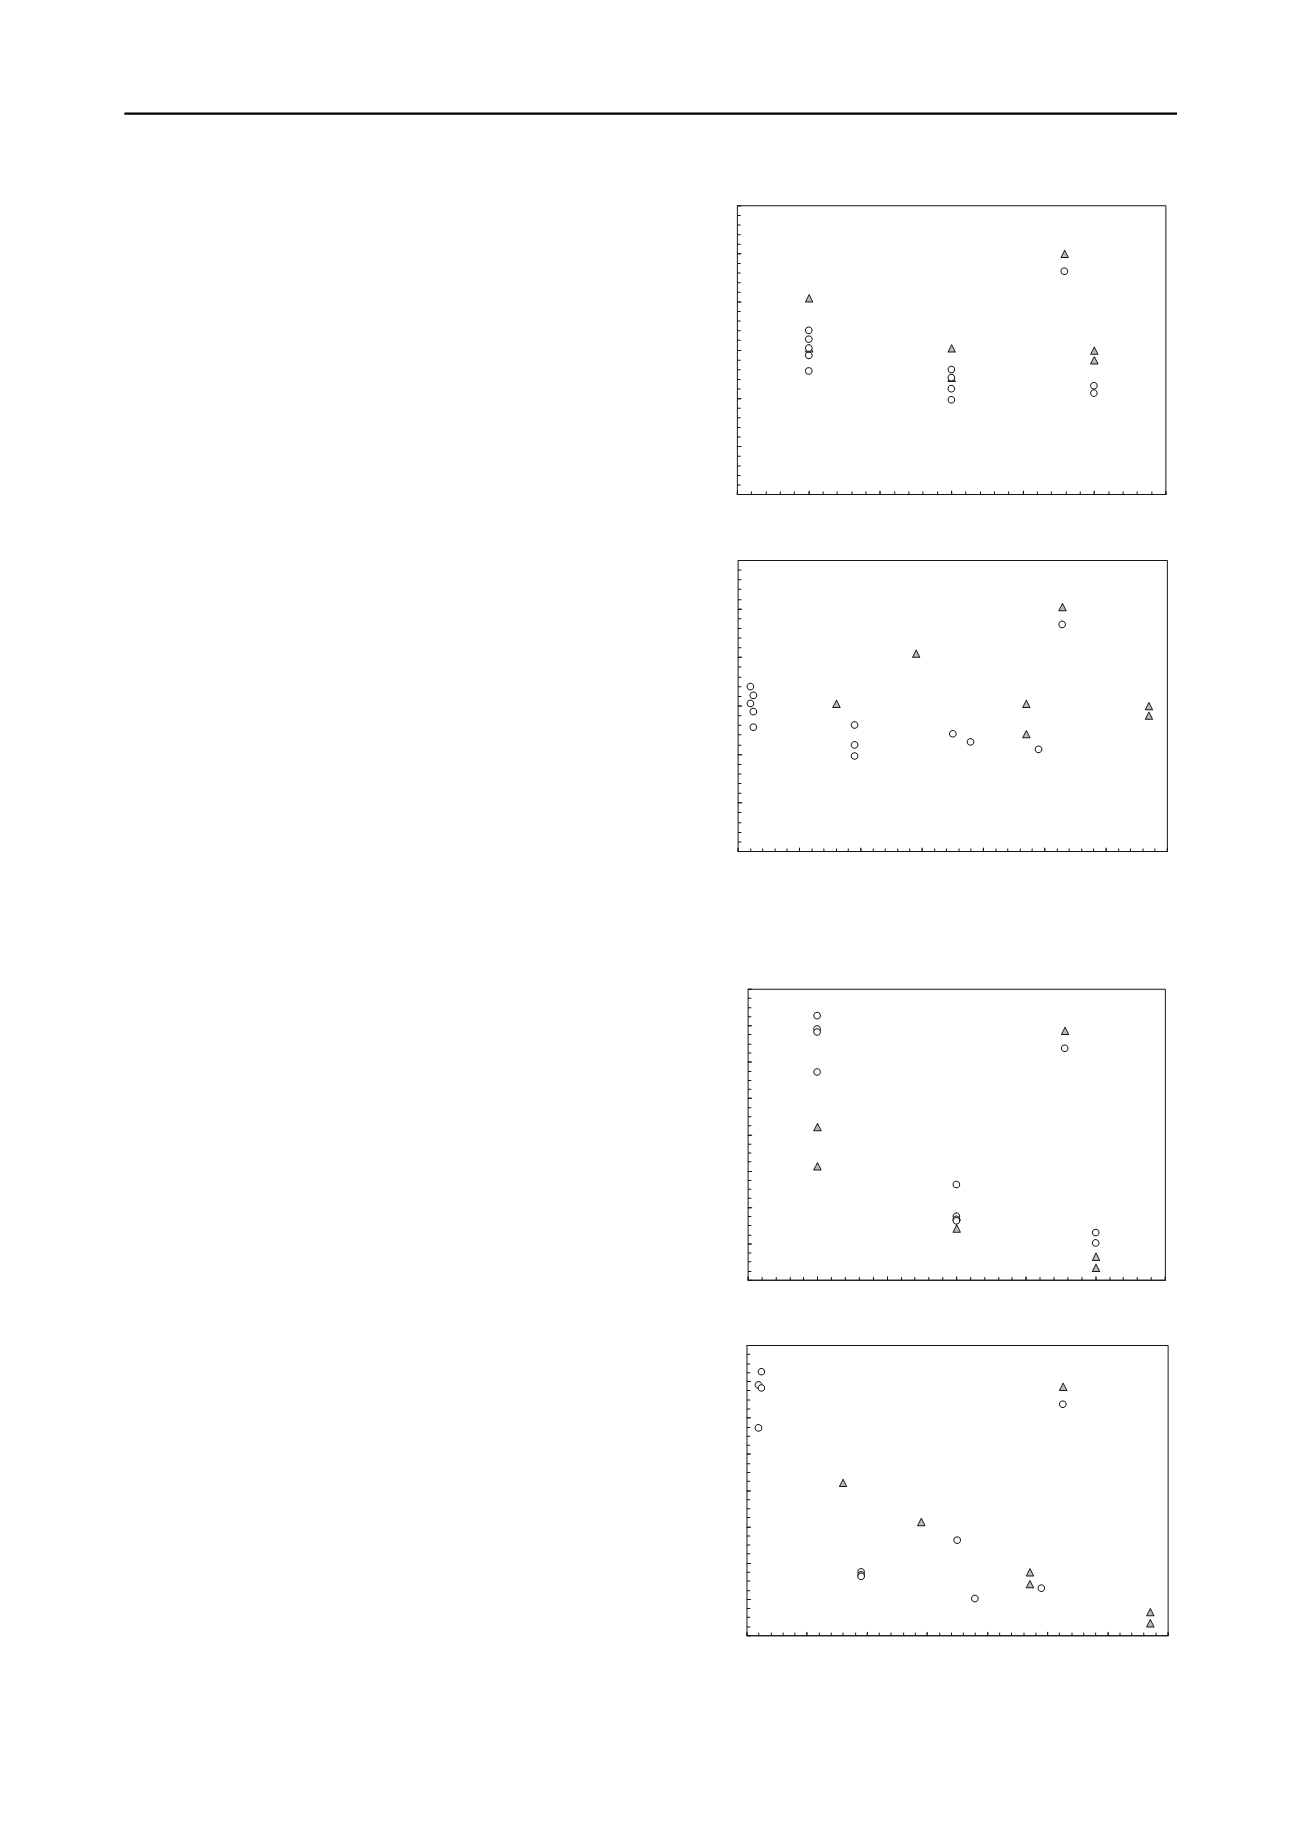
internal friction angle ranged from 40° to 50° and the effect of
W/C ratio, bleed capacity and cement grain size appear to be
insignificant. In general, the internal friction angle of the
grouted sands was up to 5° higher than the value obtained for
clean sands. The cohesion of the grouted sands is strongly
affected both by the W/C ratio and by the bleed capacity of the
grouts. As shown in Figure 5, the cohesion values of the grouted
sands ranged from 600kPa to 1450kPa, from 300kPa to 500kPa
and from 50kPa to 250kPa, for W/C ratios equal to 1, 2 and 3,
respectively. Furthermore, grouted sands injected with stable
grouts (bleed capacity values less than 5%) obtained the highest
cohesion values ranging from 1200kPa to 1450kPa. Increased
bleed capacity values (unstable suspensions) in the range of
15% to 65%, leads to an almost linear decrease of the cohesion
values from 800kPa to 100kPa. The effect of cement grain size
on grouted sand cohesion, as shown in Figure 5, where the
microfine cements exhibit higher values of cohesion than the
coarse-grained cements, by 40% to 150%, is misleading since
the suspensions used had different bleed capacities for the same
W/C ratio. For example, at W/C ratio equal to 1, the microfine
cement suspensions are stable (bleed capacity < 4%) and fill the
sand voids with cement more completely and uniformily than
the coarse cement suspensions with W/C=1 (bleed capacity
>16%).
6
SHEAR MODULUS
Presented in Figure 6 are typical results obtained for the
shear modulus, G, of grouted sands at a confining pressure
equal to 50kPa and shear strain equal to 10
-5
%. The effect of
confining pressure is not pronounced for the grouted sands
tested (Pantazopoulos and Atmatzidis 2012). As shown in
Figure 6, the shear modulus values decrease, from 4.1GPa to
30
35
40
45
50
55
60
0.5
1
1.5
2
2.5
3
3.5
Water-to-cement ratio, W/C
Internal friction angle, φ (
ο
)
100μm - 40μm
20μm - 10μm
d
max
σ
3
(kPa)
100 - 200 - 400
30
35
40
45
50
55
60
0
10
20
30
40
50
60
7
Bleed capacity (%)
Internal friction angle, φ (
ο
)
0
100μm - 40μm
20μm - 10μm
d
max
σ
3
(kPa)
100 - 200 - 400
Figure 4. Effect of grout W/C ratio and bleed capacity on the internal
friction angle of cement grouted sands.
0
200
400
600
800
1000
1200
1400
1600
0.5
1
1.5
2
2.5
3
3.5
Water-to-cement ratio, W/C
Cohesion, c (kPa)
100μm - 40μm
20μm - 10μm
d
max
σ
3
(kPa)
100 - 200 - 400
0
200
400
600
800
1000
1200
1400
1600
0
10
20
30
40
50
60
Bleed capacity (%)
Cohesion, c (kPa
70
)
100μm - 40μm
20μm - 10μm
d
max
σ
3
(kPa)
100 - 200 - 400
Figure 5. Effect of grout W/C ratio and bleed capacity on the cohesion
of cement grouted sands.


