2563
Technical Committee 211 /
Comité technique 211
Table 2 Experimental program
*:
σ′
v
=Vertical stress at end of 1D loading,
#:
d
s
= Equivalent diameter of sand column,
$:
p′
o
=Preconsolidation pressure,
**:
p′ = Mean effective stress at end of consolidation,
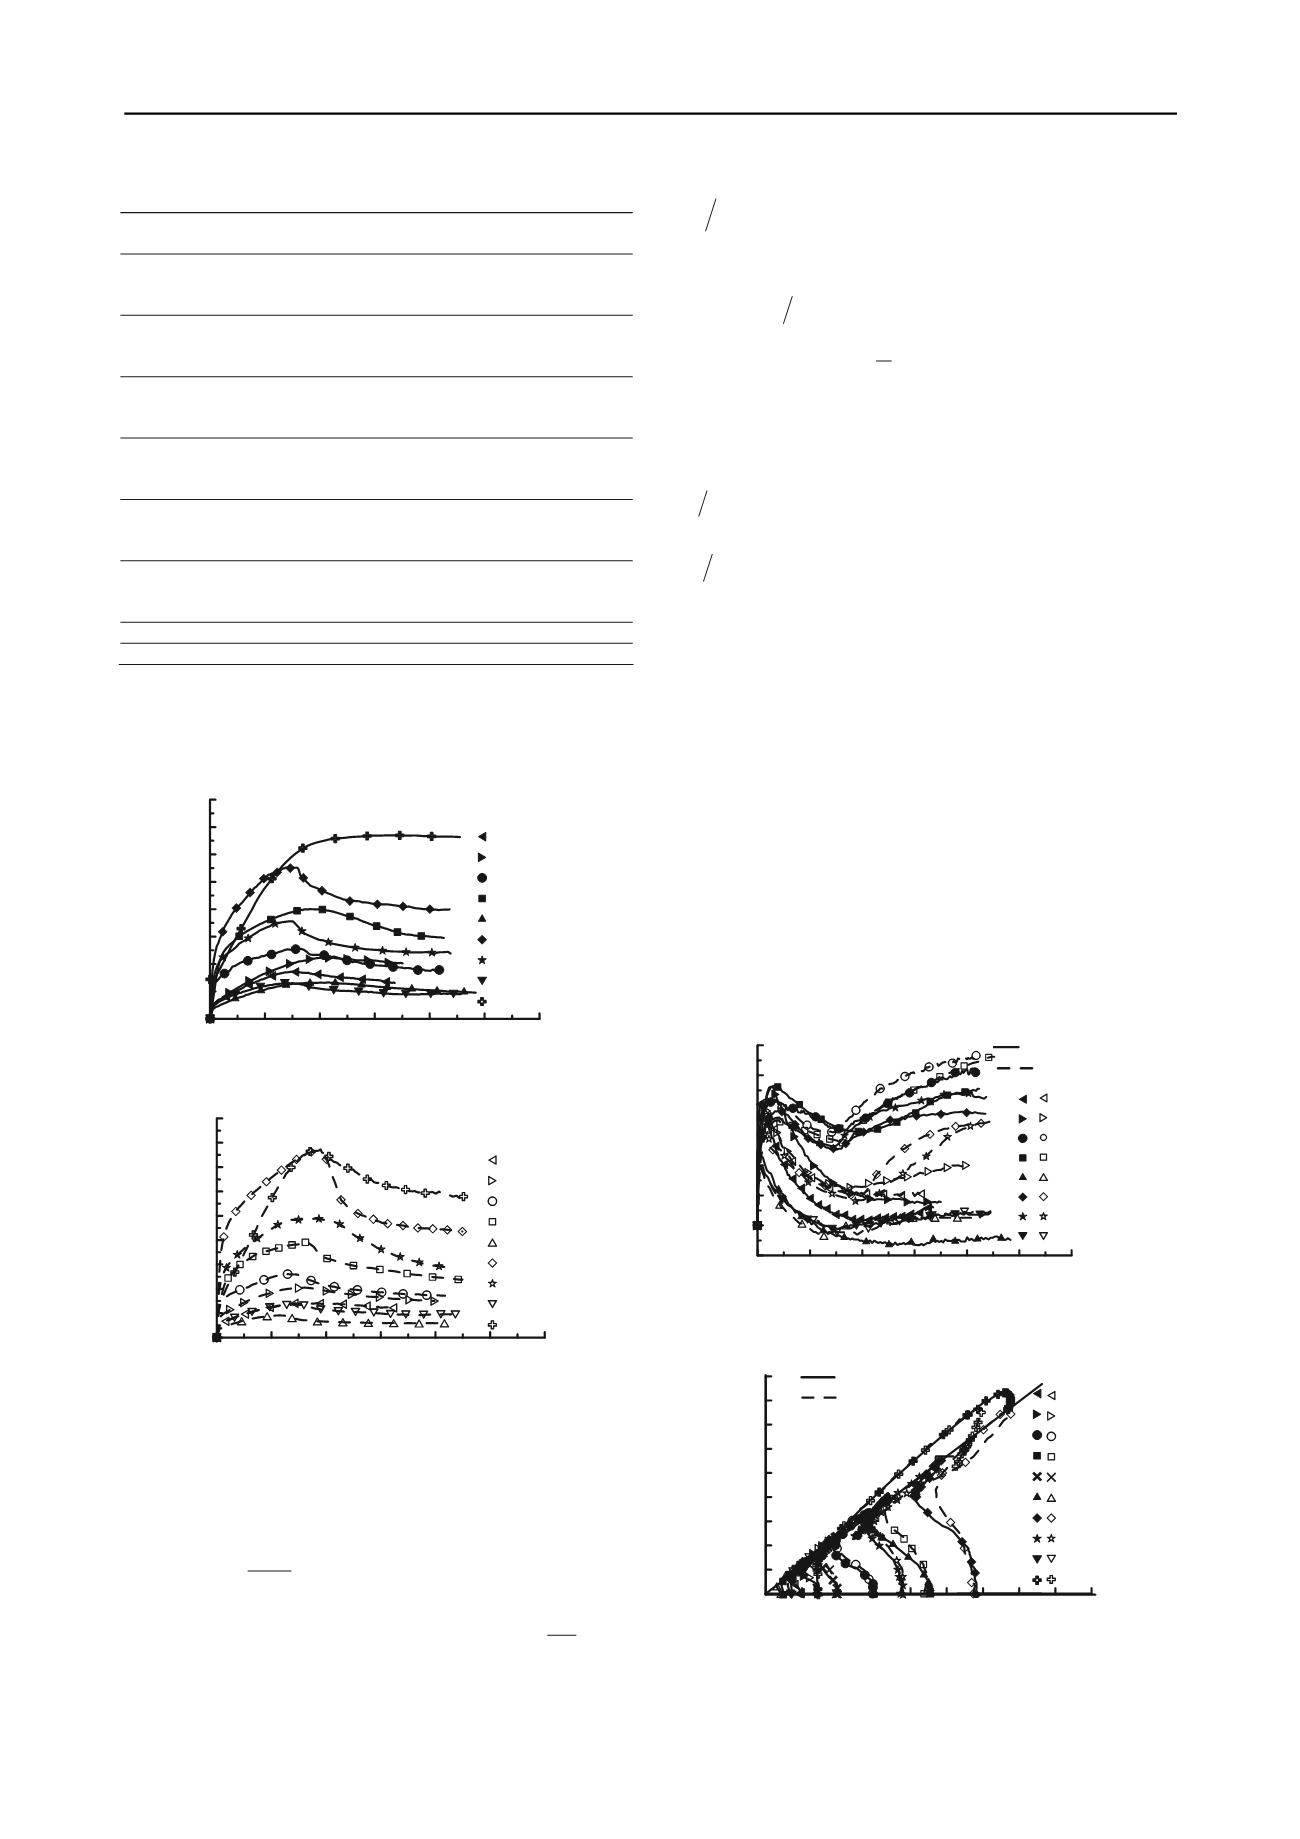
(a)
(b)
Figure 3a-b Deviator stress versus axial strain relationship for: (a)
Samples without smear zone; and (b) Samples with
smear zone.
The undrained shear strength (s
u
) of composite specimen was
taken equal to
2
max
q
, and the effect of stress history induced
over consolidation on undrained strength ratio
'
u
p
s
was
expressed as:
m OCR a
OC
'p us
(2)
where a is the normalized undrained shear strength of NC soil
equal to
NC
'
u
p s
for OCR=1, and m is an empirical
exponent equal to
1 ,
,
are soil model parameters
obtained from triaxial testing. Using test data, undrained shear
strength (s
u
) of composite ground was expressed in the
following form:
990
440
.
'
u
OCR .
p s
-
without smear
(3)
900
330
.
'
u
OCR .
p s
-
with smear effect
(4)
The evidence of the smear zone was not significant on the
ultimate undrained shear strength when 25mm and 30mm
diameter sand columns were used. What was surprising is that
the effect of smear was apparent on the ultimate shear strength
when 80mm diameter sand columns were used. It seems clear
that the presence of smear zone has reduced the ultimate
undrained shear strength by 25%. In addition, as the area
replacement ratio was increased, both the stiffness and the shear
strength of the composite samples also increased. Figure 4
show results of Skempton's (1954) pore pressure parameter,
a
,
plotted against axial strain,
a
. As seen, the A-factor in
specimens with smear effect was less from early stage of
shearing even when the specimens had the same OCR. This
was expected because the smear zone did not permit the pore
pressures to dissipate within the SCP. However, there was a
marginal increase in a-factor after passing
q
max
.
a
f
of these
samples was between 0.7 and 1.1 which is typical for normally
consolidated clays.
Figure 4. Variation of Skempton`s parameter A with axial strain for
samples with and without smear zone.
Figure 5. Effective stress paths for samples without smear and with
smear zone
Figure 5 show the effective stress path in
p'-q
stress space.
Test
No
σ′
v
*
(kPa)
d
s
#
(mm)
Smear
zone
p′
o
$
(kPa)
p′
**
(kPa)
OCR
S1
404
24.6
285
95
3
S1
404
24.6
285
146
2
S1
404
24.6
300
299
1
S1
264
29
187
95
2
S1
264
29
187
145
1.3
S1
264
29
300
289
1
S2
211
31.7
450
450
1
S2
211
31.7
200
197
1
S2
211
31.7
149
50
3
S2
211
35.7
450
434
1
S2
211
35.7
200
195
1
S2 211
35.7
149
49
3
S3
211
40
375
374
1
S3
211
40
575
575
1
S3
211
40
149
71
2.1
S3
211
45.2
575
572
1
S3
211
45.2
375
372
1
S3
211
45.2
149
68
2.2
S4
211
80
149
144
1
S4
211
80
149
142
1
0
5
10
15
20
25
30
Axial strain (%)
0
100
200
300
400
500
600
700
800
q (kN/m 2 )
Test
S1:100kPa
S1:150kPa
S1:300kPa
S2:450kPa
S2:50kPa
S3:575kPa
S3:375kPa
S3:75kPa
S4:150kPa
Without smear
0
5
10
15
20
25
30
Axial strain (%)
-0.2
0
0.2
0.4
0.6
0.8
1
1.2
A-factor
S1:100kPa
S1:150kPa
S1:300kPa
S2:450kPa
S2:50kPa
S3:575kPa
S3:375kPa
S3:75kPa
With smear
Without smear
0
5
10
15
20
25
30
Axial strain (%)
0
100
200
300
400
500
600
700
800
900
q (kN/m 2 )
Test
S1:100kPa
S2:150kPa
S1:300kPa
S2:450kPa
S2:50kPa
S3:575kPa
S3:375kPa
S3:75kPa
S4:150kPa
With smear
0 100 200 300 400 500 600 700 800 900
p' (kN/m 2 )
0
100
200
300
400
500
600
700
800
900
q (kN/m 2 )
S1:100kPa
S1:150kPa
S1:300kPa
S2:450kPa
S2:200kPa
S2:50kPa
S3:575kPa
S3:375kPa
S3:75kPa
S4:150kPa
CSL
M
1
With smear
Without smear


