2559
Technical Committee 211 /
Comité technique 211
4 nUmerical analYses
4.1
Finite element model
plane-strain finite element model of the improved ground is
made (fig. 7). the behavior of soil is modeled as mohr-
coulomb material. linear bar elements that only have tensile
strength are used for the geogrids. the concrete pavement is
modeled by using linear beam elements. interface elements are
included for modeling the interaction between the soil and the
structure elements.
the loading of the pavement is assumed as uniformly
distributed with a value of 30 kpa for combination of dead and
live static loads and with a value of 45 kpa for seismic load
combination. Before the pavement loading calculations, the
initial condition of gravity loading is formed by the
k
0
-
procedure. the construction stages of consecutive excavation
and the replacement of the soil are simulated by means of
phases of calculation with various fe meshes. an impermeable
bottom boundary of the fe model is assumed in consolidation
analysis.
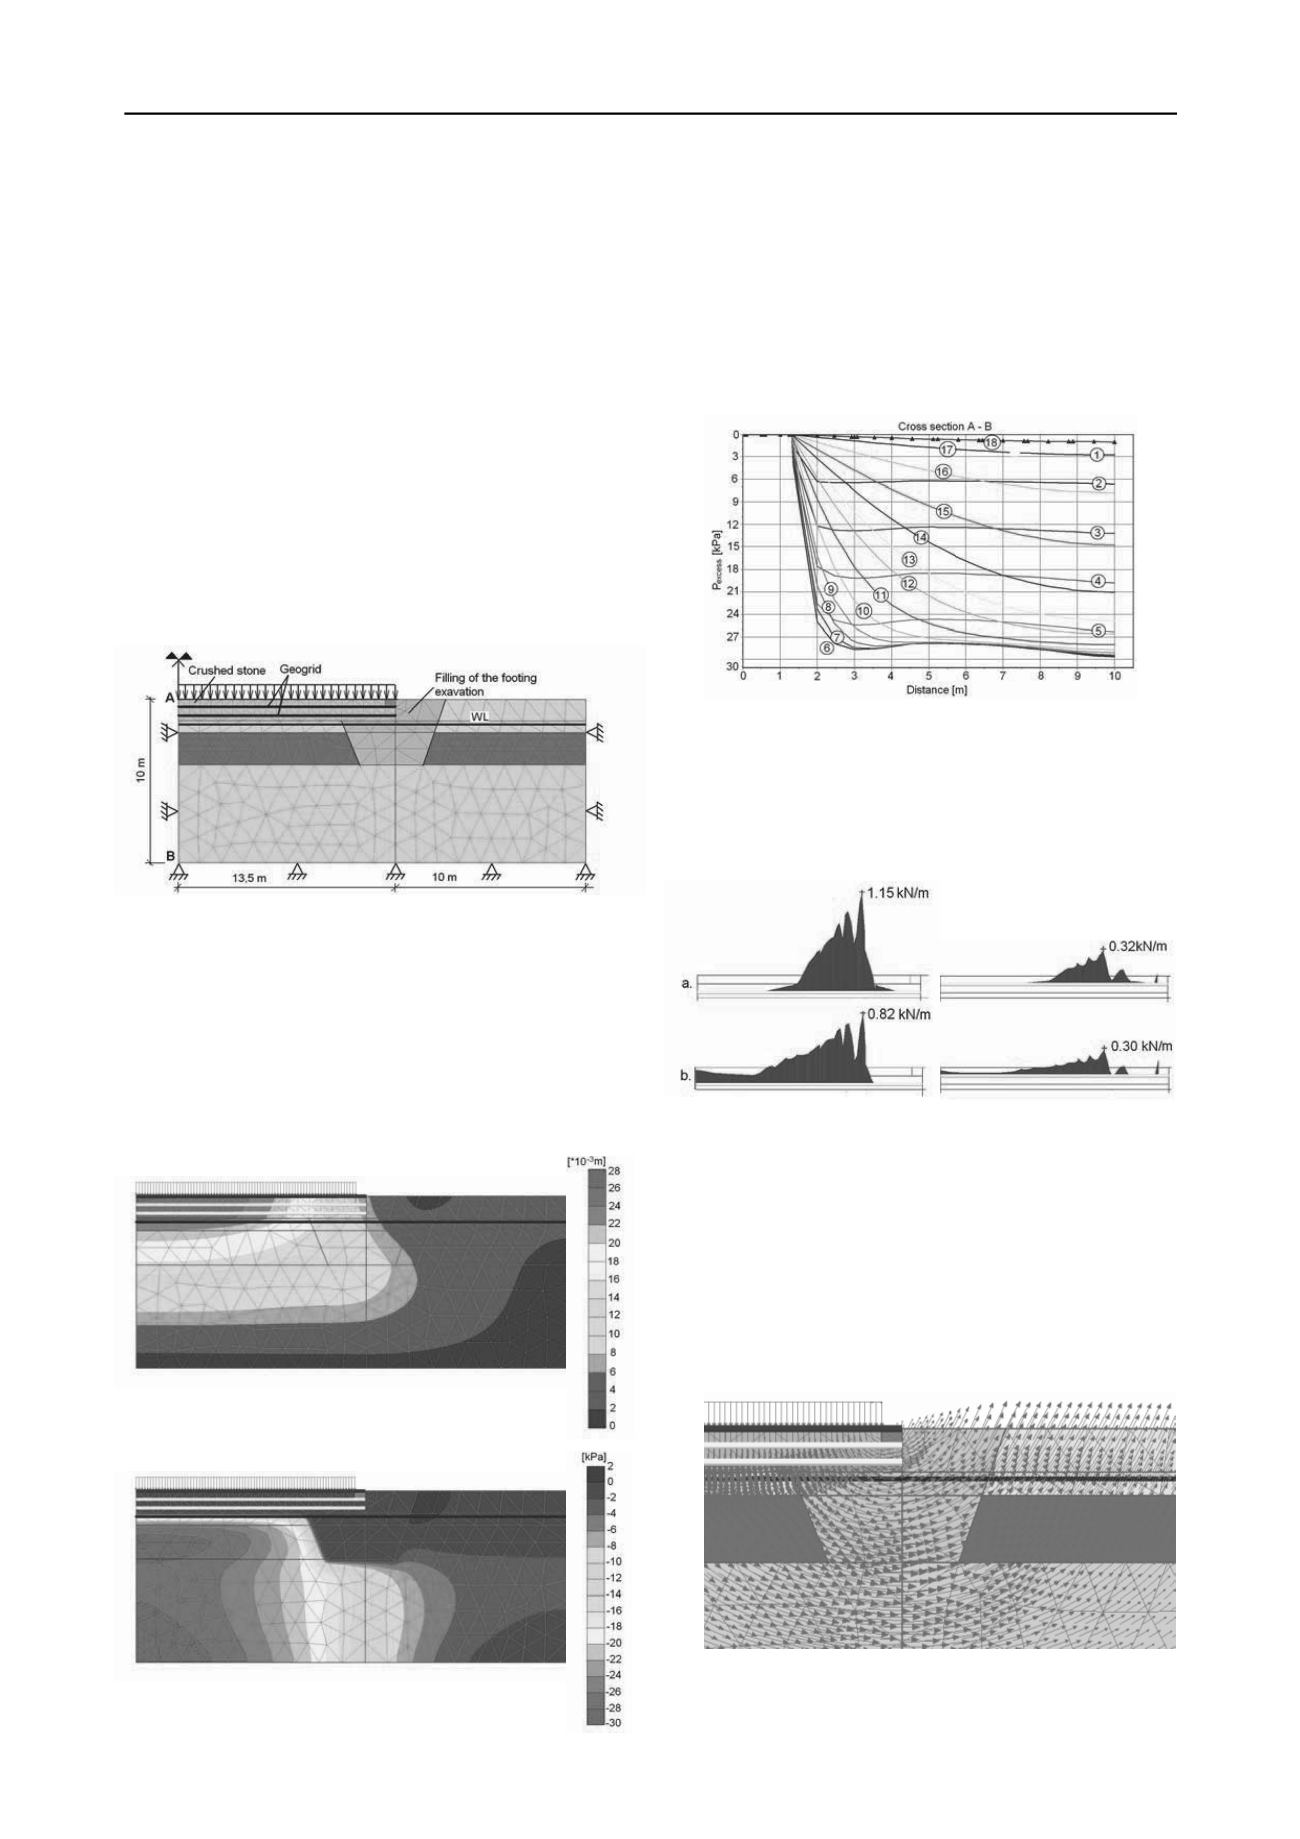
figure 7. finite element model
4.2
Results from FE analyses
4.2.1
Consolidation of the ground at dead and live loads
the consolidation process is investigated, and 3 years and 4
months is the time of the pore pressure dissipation. the
maximum value of the pavement settlement is 2.62 cm at point
a (fig. 7) and this value corresponds to the end of the
consolidation process. the distribution of the vertical
displacements is shown in figure 8.
figure 8. the vertical displacements
figure 9. pore pressure distribution
the maximum pore pressure values are obtained
immediately after the load application, and its distribution is
represented in figure 9. it is evident that in all clayed soils under
the pavement the pore pressure increases up to the value of the
applied load. the 29.6 kpa maximum value of pore pressure is
calculated at point B situated at the bottom of the field. the
consolidation curves pore pressure vs. distance at 18 time steps
are shown in figure 10 for the cross section a – B. step number
6 is related to the loading completion.
figure 10. the curves pore pressure vs. distance
the membrane forces of geogrids, caused by vertical
loading, reduce the normal stresses under it. the maximum
value of the normal stresses on the soft subsoil at the bottom of
the crushed pad is 52.3 kpa. figure 11 presents the tensile
forces in geogrids.
( i layer ) ( ii layer )
figure 11. the forces in geogrids at time moments: (a) at a pavement
loading; (b) at the end of consolidation
4.2.2
Stability of the ground at seismic load combination
the undrained analysis is performed and the lateral
displacements are estimated. the vectors of the total
displacements are shown in figure 12. the maximum horizontal
displacement is 1.4 cm and it occurs at depth of 4 m under the
crushed stone filling of the foundation excavation. the zones of
lateral displacements are located, as shown in figure 13, and the
stability of the ground is provided.
figure 12. the vectors of the total displacements


