2558
Proceedings of the 18
th
International Conference on Soil Mechanics and Geotechnical Engineering, Paris 2013
is being examined at a depth of up to 10 m, where solid clay
lies.
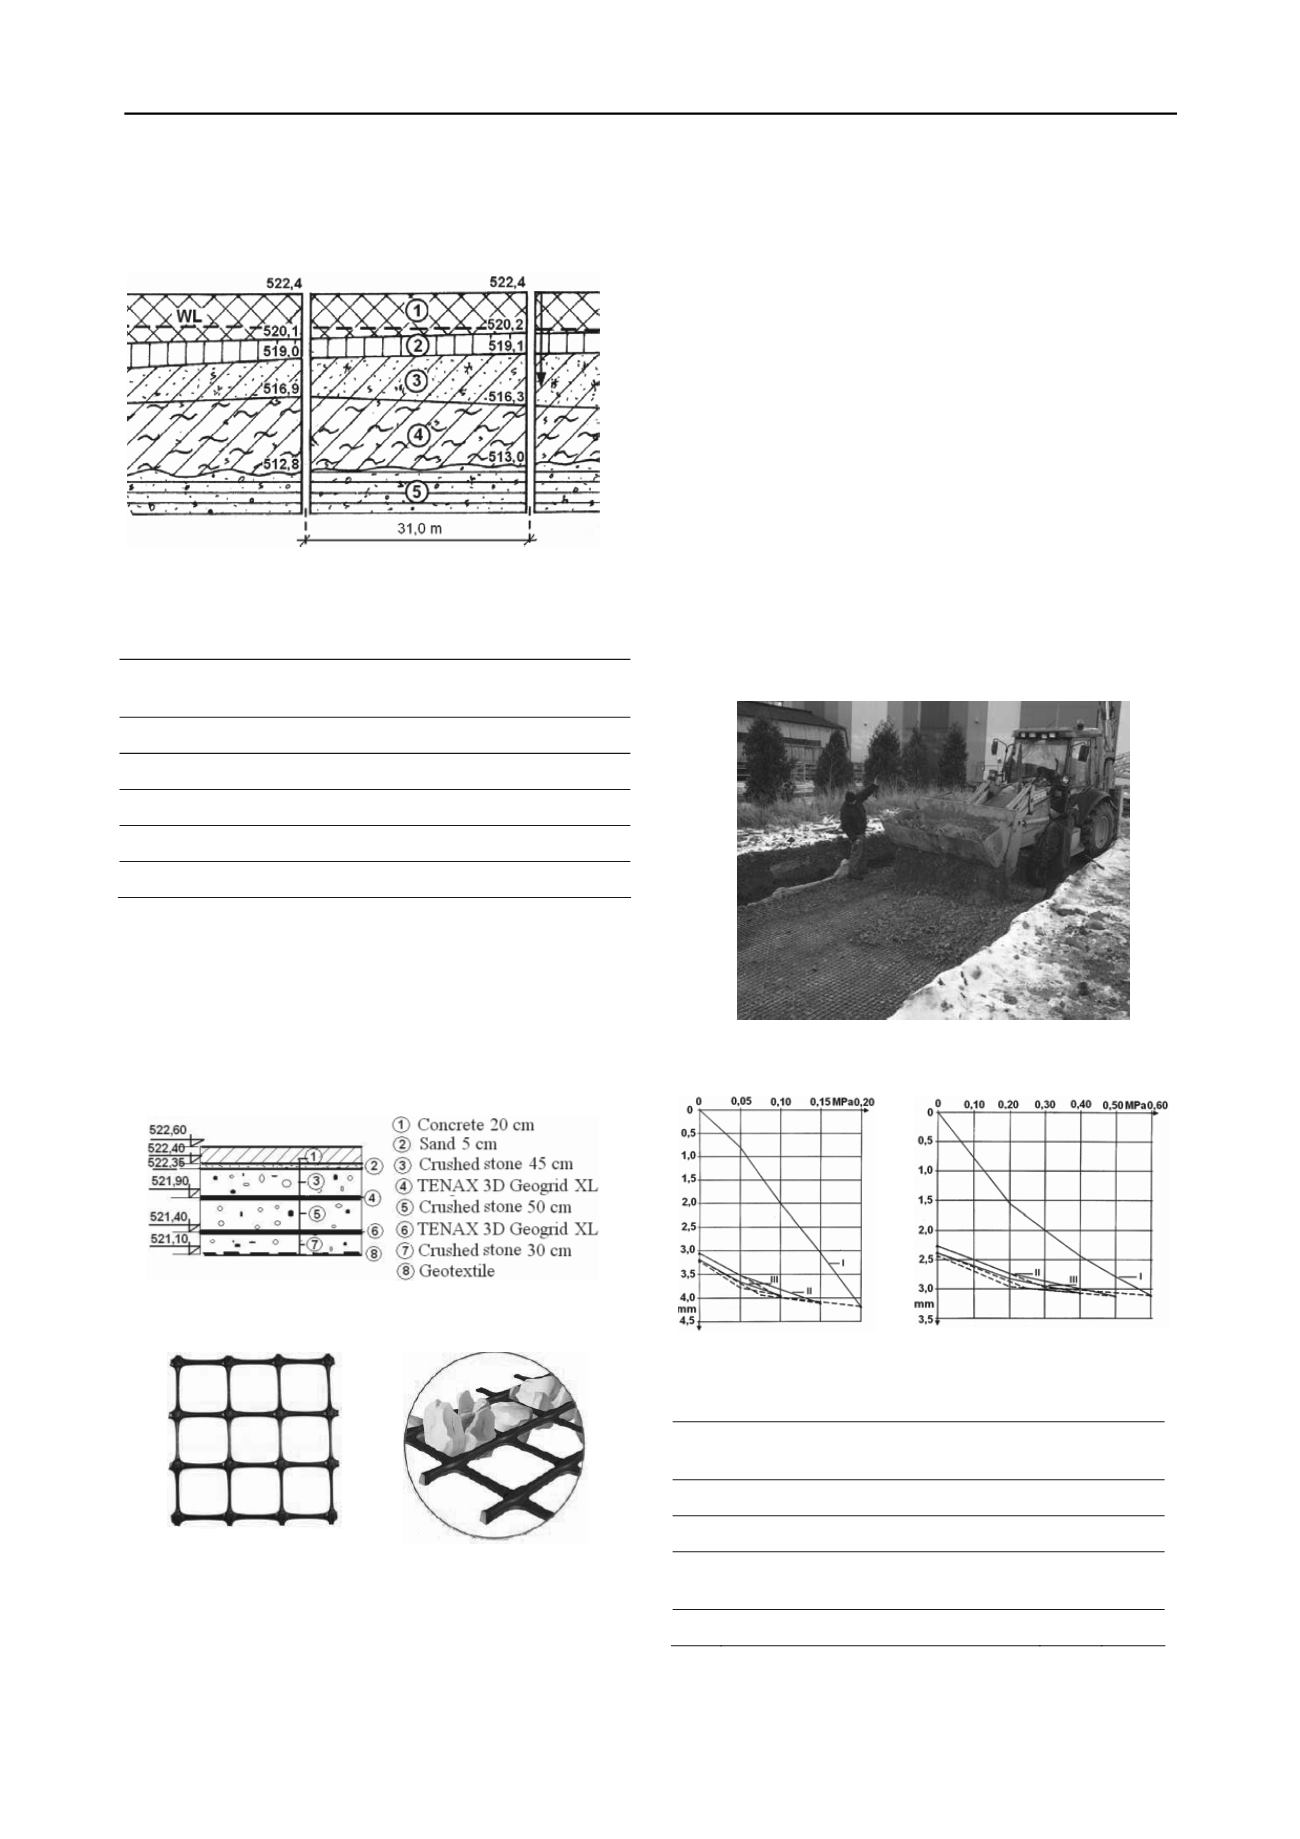
figure 2. Geological profile
table 1. average values of the soil layers characteristics.
no.
soil type
e
-
γ
kn/m
3
c'
kpa
φ'
deg
E
mpa
1 top soil
1,35
1,45
11,0
8,0
3,5
2 Black clay
1,30
1,62
15,0
5,0
3,5
3 Brown clay
0,95
1,86
32,5
7,0
8,5
4 silty clay
1,41 1,70 11,0
5,0
6,0
5 sandy clay
0,82
1,89
32,5
18,5
15,0
2.2
Structure of the reinforced crushed stone pad
investigations about the stress-strain behavior of the improved
soil ground with various thickness values of the crushed stone
pad, various numbers and various stiffness values of the
geosynthetic layers have been carried out in advance by fem
models. the optimal structure of reinforced pad with regard to
mechanical behavior of improved soil is obtained (fig. 3).
figure 3. structure of the reinforced crushed stone pad
figure 4. tenaX 3d Geogrid Xl (
)
the pad should be built of stone particles sized 0–85 mm,
and should be 1.3 m thick. the reinforcement is composed of
two polypropylene tenaX 3d geogrid Xl layers which have
particularly large concaved shaped ribs that enhance the
interaction mechanism between grids and stone particles by
restricting the horizontal movement of particles (fig. 4).
technical characteristics of the geogrids are: bi-axial stiffness
900/600 kn/m at 0.5% strain and coefficient of friction
soil/geogrid 1.2 (
.
3 field testinG procedUre
to determine the e-modulus of the improved ground, a field
test program is performed. it includes the construction of the
reinforced pad of area 150 m
2
and an application of a static
loading by rigid plate of dimension 30 cm at the following four
stages of construction: (1) after compaction of the natural
ground; (2) after building the first layer of crushed stone with a
thickness of 30 cm; (3) after placing the first geogrid layer and
building the second crushed stone layer with a thickness of 50
cm; (4) at the end of the pad construction. at each stage three
loading/unloading cycles are applied by steps of 0.05 mpa and
settlement/load curves are obtained. the
E
-modulus of total
settlement and the
E
e
-modulus of their elastic part are estimated,
and the results are shown in table 2. the settlement/load curves
for the first and the last stage of pad construction are shown in
figure 6. the moduli values increase more than five times after
the soil ground improvement.
figure 5. construction of the experimental reinforced crushed stone pad
figure 6. settlement/load curves for the plate loading tests
table 2. Values of the
E
-moduli of the soil ground at field testing
no.
stage of the pad construction
E
mpa
E
e
mpa
1 compaction of the natural ground
10,0
33,0
2 the first 30-cm-thick stone layer
25,7
60,0
3 the first geogrid layer and the second 50-
cm-thick stone layer
44,3
121,0
4 the end of the pad construction
57,7
181,0


