2551
Technical Committee 211 /
Comité technique 211
4 Geomaterial soil-cement colUmn
characteriZation
the cement used for the construction of soil-cement columns
was of the portland type cem i 52.5 sr. the slurry mix was of
a cement / Water type with the relation 1/1. the average
penetration rate for the construction of columns was 30 cm/min
with the rotation velocity of 50 to 55 rpm and the average
cement consumption of 350 kg/m
3
.
the unconfined compressive strength tests (Ucs) were
performed both on drilled core samples and wet grab samples
(cylinder dimensions height / diameter > 2), both of them
usually being the main mean of the quality control of wet deep
mixing methods. three core samples were taken from different
soil-cement trial test columns, 21 days after the completion of
the soil-cement columns. the samples were cored at a distance
of 110 mm to 120 mm from the centre of columns. the overall
average total core recovery was more than 97% for all soil-
cement columns. Wet grab samples were taken in the half an
hour after execution of columns and were tested at same age as
core samples. the Ucs tests were also used to determine the
stiffness modulus e
50
(secant value of Young´s modulus of
elasticity determined at 50% of Ucs).
the Ucs values of wet grab samples after 7 days varied
from 1.4 to 3.9 mpa, while Ucs values for drilled core samples
on 28 days ranged from 2.2 to 4.4 mpa and axial failure strain
values varied from 1 to 1.2 %. stiffness modulus values
determined from Ucs tests varied from 270 to 330 mpa, with
the average relationship between e
50
and Ucs resulting in
approximately 100.
some of the drilled core samples extracted from soil-cement
trial test columns is presented in figure 4. it can be observed
uniformly treated springsol
columns.
figure 4. drilled core samples of soil-cement columns.
5 nUmerical model
5.1
General data
When using finite element analysis to model deep mixed
columns installed in a periodic pattern, the problem is usually
modelled in a 2d axisymmetric model, referred as a unit cell
model. the homogenization equivalent model is usually not
used due to lack of access to column stresses.
the radius of the unit cell depends on the grid spacing:
s R
eq
(1)
where: r
eq
is the radius of the unit cell and s is the grid
spacing.
in this project different square grid patterns (grid spacing
varying from 1.50 to 2.00 m) depending on the surcharge of the
slab (ranging from 10.00 to 20.00 kn/m
2
) are taken into
account.
in this study the commercial finite element code used for 2d
modelling is plaxis (version 8.6). Both the soft soil and the soil-
cement column behaviour are modelled by the elastic-plastic
mohr-coulomb failure criterion, while the slab is characterized
by the elastic law. the load transfer layer formed by grouting
the gap within the contact gravel layer below the existing slab
of the approximate thickness of 20 cm is modelled by the mohr-
coulomb law. Geotechnical parameters of each material (ltl-
load transfer layer, cU-upper clay layer, cm-medium clay
layer, nsc-natural soil clay layer, sc-soil cement column) used
in the numerical analysis are given in table 2.
the cross section of the fe model is presented in figure 6
showing the geometry and soil layers used in analysis, as well
as the finite element mesh.
table 2. material parameters.
parameter
LTL
CU CM NSC
SC
thickness
(m)
0.2
4.0-
6.5
1.5
>4.5
density
(kn/m
2
)
22
16
17
18
20
cohesion
(kpa)
500
5
10
20
500
friction
angle (º)
40
18
20
22
35
Young
´
s
modulus (mpa)
300
2.5
5.0
50
300
poisson ratio
0.2
0.3
0.3
0.3
0.2
5.2
Results
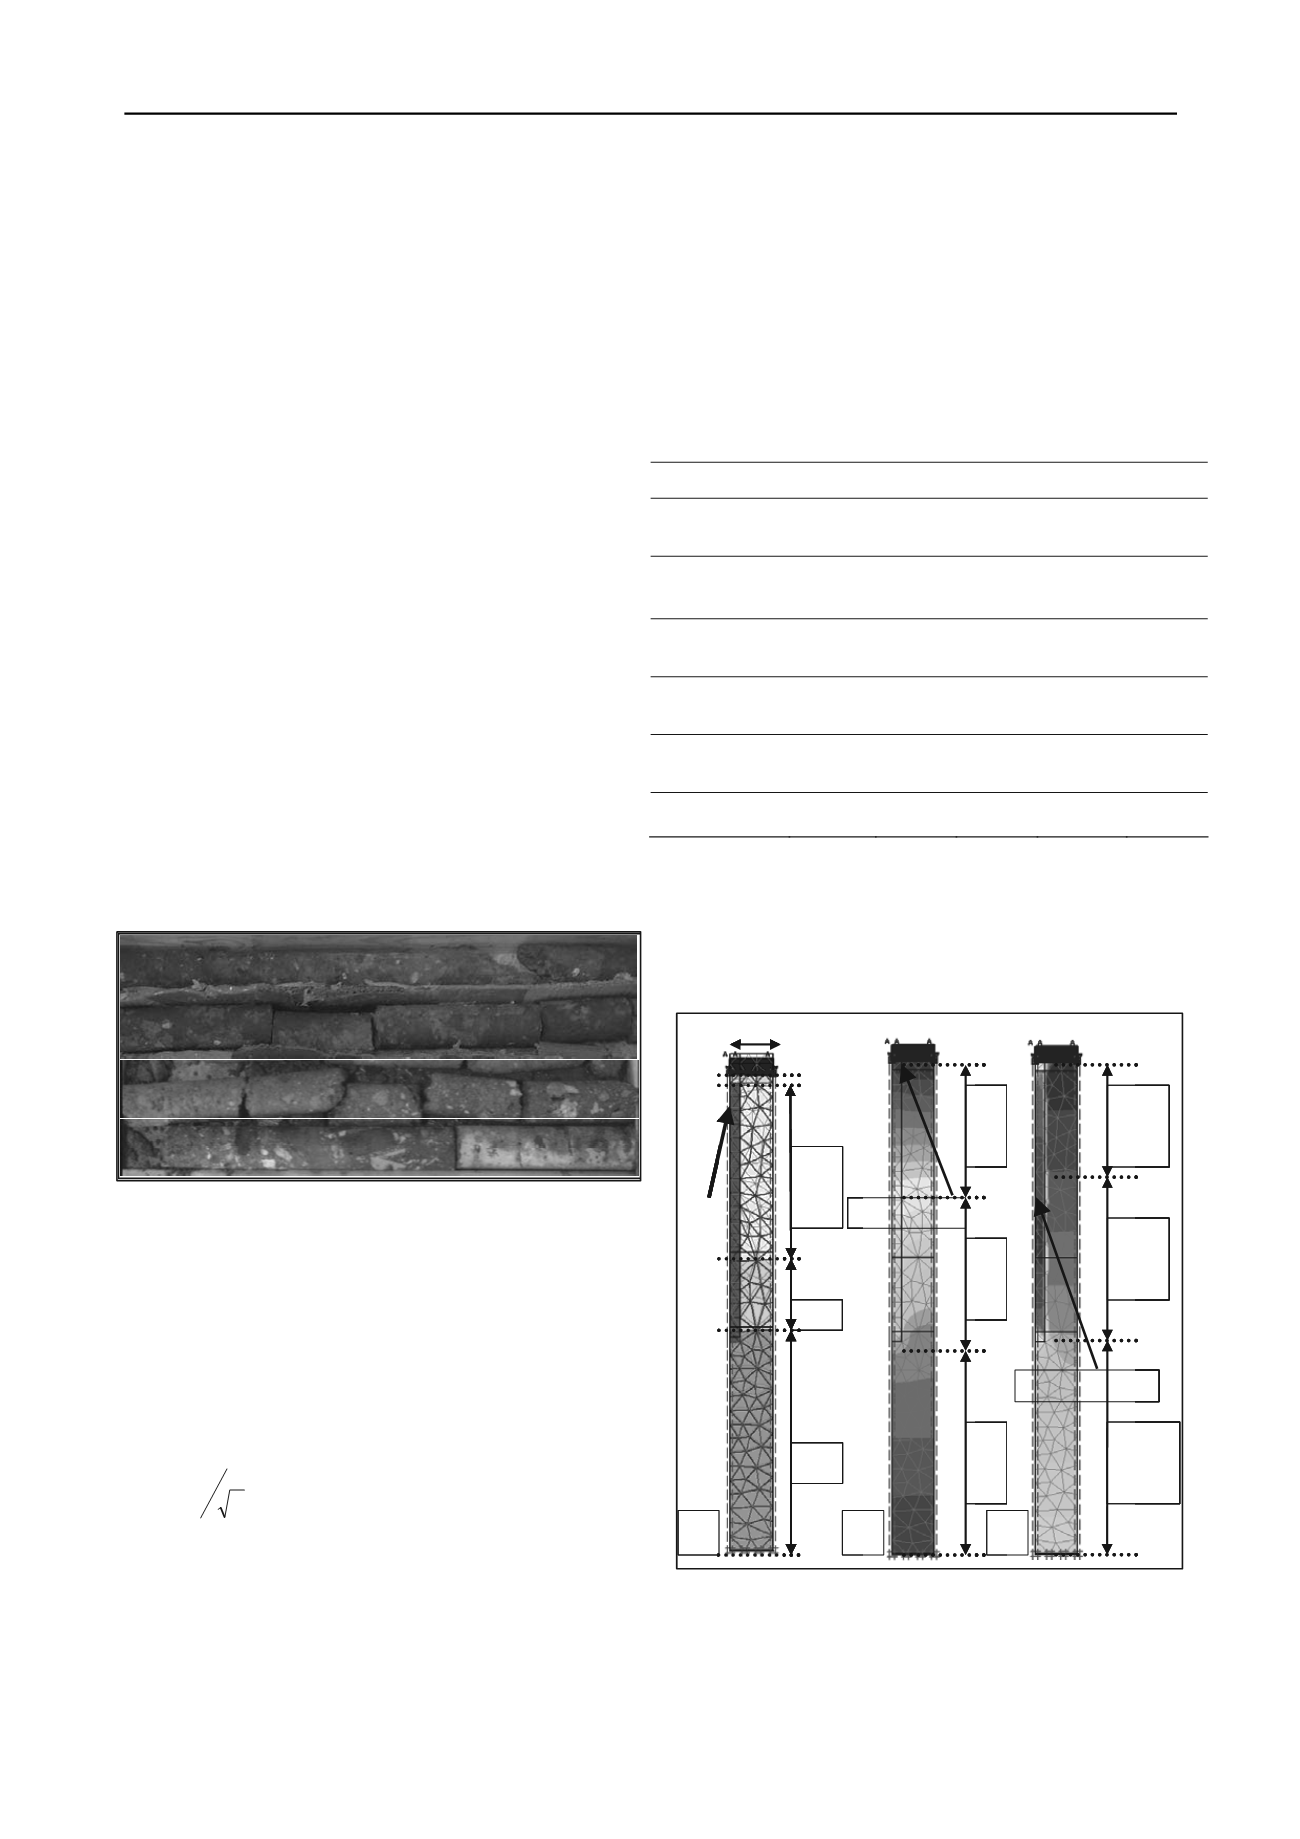
figure 6 present the employed mesh in the fem model, and the
results regarding vertical displacements and axial stresses for
the case of the grid spacing of 1.50 m corresponding to the
surcharge of 20 kn/m
2
.
figure 6. numerical modeling results for reinforced soil. (a) Geometry
of the unit cell – mesh and model dimensions. (b) Vertical
displacements. (c) axial stresses.
max 7.85 mm
5-8
mm
2-5
mm
0-2
mm
max 385.6 kN/m
2
0-50
kN/m
2
50-150
kN/m
2
150-200
kN/m
2
R
eq
1.5m
4.0m
-
6.5m
SC
CM
CU
LTL
4.5m
NSC
a
b
c
the homogenized settlements as well as negligible
differential settlements due to high rigidity of the load transfer
layer, formed by grouting the layer of gravel below the slab, and
soil-cement columns can be observed in figure 6-b.


