2546
Proceedings of the 18
th
International Conference on Soil Mechanics and Geotechnical Engineering, Paris 2013
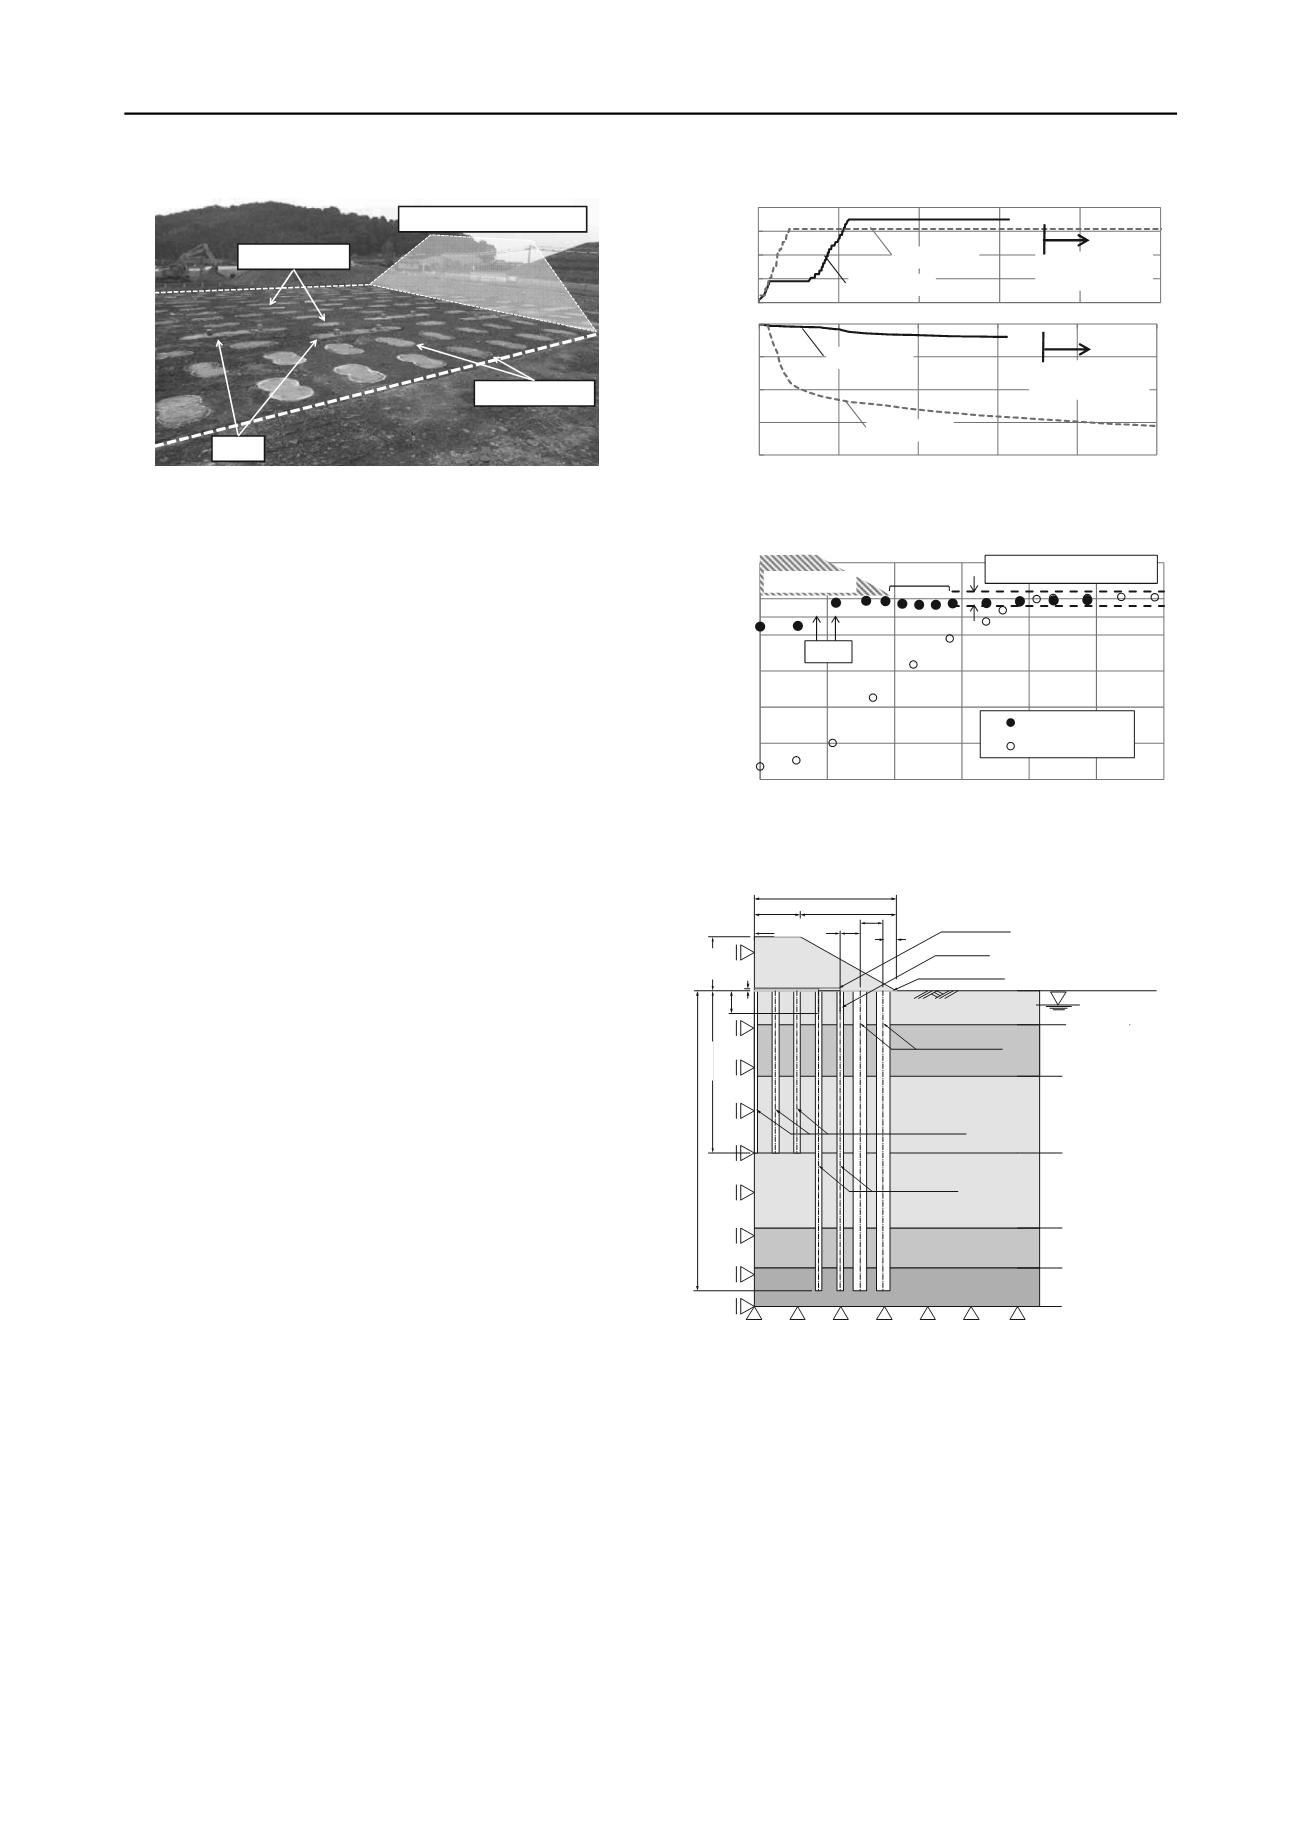
Wal l s
Out si de pi l es
I nsi de pi l es
Out l i ne of embankment
Figure 2.Ground surface after soil improvement.
bear the embankment loads as well as the lateral movement of
the soft ground. Deep mixing piles are placed inside and outside
the walls to restrict vertical and horizontal deformation caused
by the embankment.
Figure 1 shows an example of the arrangement of deep
mixing columns and walls at a site. The function and placement
of each pile and wall are explained below.
Inside piles: Columns placed in the ground directly under
the crown of the embankment. This part transfers the load from
the center part of the embankment to the deep layer.
Walls: Walls are placed in the ground under the edges of the
embankment crown. This part bears a large part of the
embankment load and prevents the soil from moving.
Outside piles: Columns placed in the ground directly under
the embankment slopes. This part transfers the load of the
embankment slopes.
This method is designed to economically satisfy the limit
value of settlement by optimizing and minimizing these parts in
the design.
3 TRIAL EMBANKMENT
3.1
Work outline
The effectiveness of this method was demonstrated in a road
construction project along the Ariake Sea in Kumamoto
Prefecture. The soft clay at the construction site was about 40 m
thick, so a large volume of settlement could be expected after
constructingan embankment 7m in height. Some parts of the
proposed road were close to residential buildings. Therefore, a
limit value for deformation was set not only for the
embankment but also for the area adjacent to the embankment,
as described below.
Embankment: Settlement sincethe start of service is equal to
or lower than 300 mm.
Adjacent area: Lateral and horizontal displacement since the
start of construction is equal to or lower than 20 mm.
During the design stage, many of the arrangements were
compared using two- and three-dimensional effective stress
analysis. After considering all of the above, the arrangement
shown in Fig. 1 was determinedto be optimal. Each column had
a design strength of 1.0MN/m
2
, and the arrangement hadan
improvement ratio of 18.5%.
Before the embankment was constructed, settlement plates
and pressure gauges were installedfor the purpose of taking
measurements. The ground surface after soil improvement is
shown in Fig. 2.
3.2
Result of construction
Figure 3 shows the settlement history of the ground surface at
the center of the embankment. The same figure also shows a
similar settlement history, observed at a trial embankment
nearby with no subsoil treatment. In the improvement case,
200mm of settlement occurred one year after embankment
construction. Subsequently, settlement converged in both cases.
0
2
4
6
8
Improvement
Starting date of
service
No treatment
Height of
embankment (m)
0
500
1000
1500
2000
0
200
400
600
800
1000
Starting date of
service
No treatment
Improvement
Elapsed days (day)
Settlement of
embankment (mm)
Figure 3.History of ground surface settlement in at the center of the
embankment.
‐100
0
100
200
300
400
500
0
10
20
30
40
50
6
Distance from center line of embankment (m)
0
Improvement
No treatment
Walls
Limit value
:±
20mm
Embankment
10m
Settlement after construction
of embankment (mm)
Figure 4.Distribution of ground surface settlement after construction of
the embankment.
4@2810 2600 3000
12600
18600
1760
1:1.8
7000
21200
GL ‐1.90m
6000
Geotextile
Steel wire
H steel
3000
300
Inside piles
39200
Walls
Outside piles
As2
Ac2‐2
Ac1‐2
Ac2‐3
Dvc
Dvs
GL ‐4.50m
GL ‐11.20m
GL ‐21.20m
GL ‐31.00m
GL ‐36.20m
GL ‐41.60m
Figure 5.Section view of the numerical model.
Figure 4 shows the settlement history fora one-year period
after the construction road was removed.In the improvement
case, large the walls prevented deformation under the
embankment, keeping the settlement around the embankment
below the limit value. The vertical strain measured in the walls
is shown in Fig. 7; this, too, was kept below the fracture strain
value.
3.3
Back-analysis
To investigate the applicability of two-dimensional effective
stress analysisunder actual construction conditions, the
geological profile and mechanical properties of the deep mixing
columns were analyzed using Plaxis 2D Ver.9.02.
The numerical model is shown in Fig. 5. Due to the
symmetry of the embankment, only half of the geometry was
considered for the model. The distance from the embankment
Table 1.Material properties used for numerical model


