2547
Technical Committee 211 /
Comité technique 211
Unit
weight
γ
t
(kN/m
3
)
Effective
cohesion
c'
(kN/m
2
)
Effective
angle of
friction
φ'
(deg.)
Deformation
modulus
E
(kN/m
2
)
Initial
void
ratio
e
0
Consolidation
yield stress
p
c
(kN/m
2
)
Compression
index
λ
Expansion
index
κ
Critical
state
parameter
M
Poisson’s
ratio
ν
Coefficient
of
permeability
k
(cm/sec)
Embankment 19.0
10.0
35.0
28,000
-
-
-
-
-
0.25
1.00×10
-3
Ac1-2
14.6
10.0
36.4
1,720 2.13
36.8
0.289
0.029
1.48
0.35
1.30×10
-6
As2
18.7
-
-
28,000
-
-
-
-
-
0.25
1.00×10
-3
Ac2-2
14.3
10.0
36.2
6,380 2.53
146.1
0.665
0.067
1.47
0.35
3.00×10
-7
Ac2-3
15.1
10.0
33.0
7,130 2.00
178.5
0.408
0.041
1.33
0.35
2.30×10
-7
Dvc
15.8
10.0
33.0
6,510 1.21
215.7
0.149
0.015
1.33
0.35
1.40×10
-9
Dvs
19.0
-
-
70,000
-
-
-
-
-
0.35
1.00×10
-3
Columns
19.0
-
-
367,000 –
718,000
*1
-
-
-
-
-
0.20
1.40×10
-9
-
1.00×10
-3*2
*1 The deformation modulus of thedeep mixing columns was derived from quality verification tests, which reduced dependence on the improvement
ratio.
*2 The coefficients of permeability of the deep mixing columns are same as those for each layer.
toe to the lateral boundary is 80m. As a boundary condition of
deformation, the bottom surface was fixed. The side surface was
free verticallyand fixed horizontally.As a drainage condition,
excess pore water pressures at the ground surface and bottom
surface were set to zero.
The soil layer is modeled as an elasto-plastic material using
the Sekiguchi-Ohta model (Sekiguchi and Ohta 1977). The sand
layers and deep mixing columns are modeled as a linear elastic
material. The embankment is modeled as an elasto-plastic
material using the Mohr-Coulomb model. Table 1 lists the
model parameters used for the analysis.
The history of the embankment construction was modeled
bybuilding up the elements. In converting from actual three-
dimensional ground to the two-dimensional numerical model,
the deformation modulus of the deep mixing columns was
reduced according tothe improvement ratio and the coefficient
on permeability for deep mixing columns was set to thevalue for
each layer of ground.
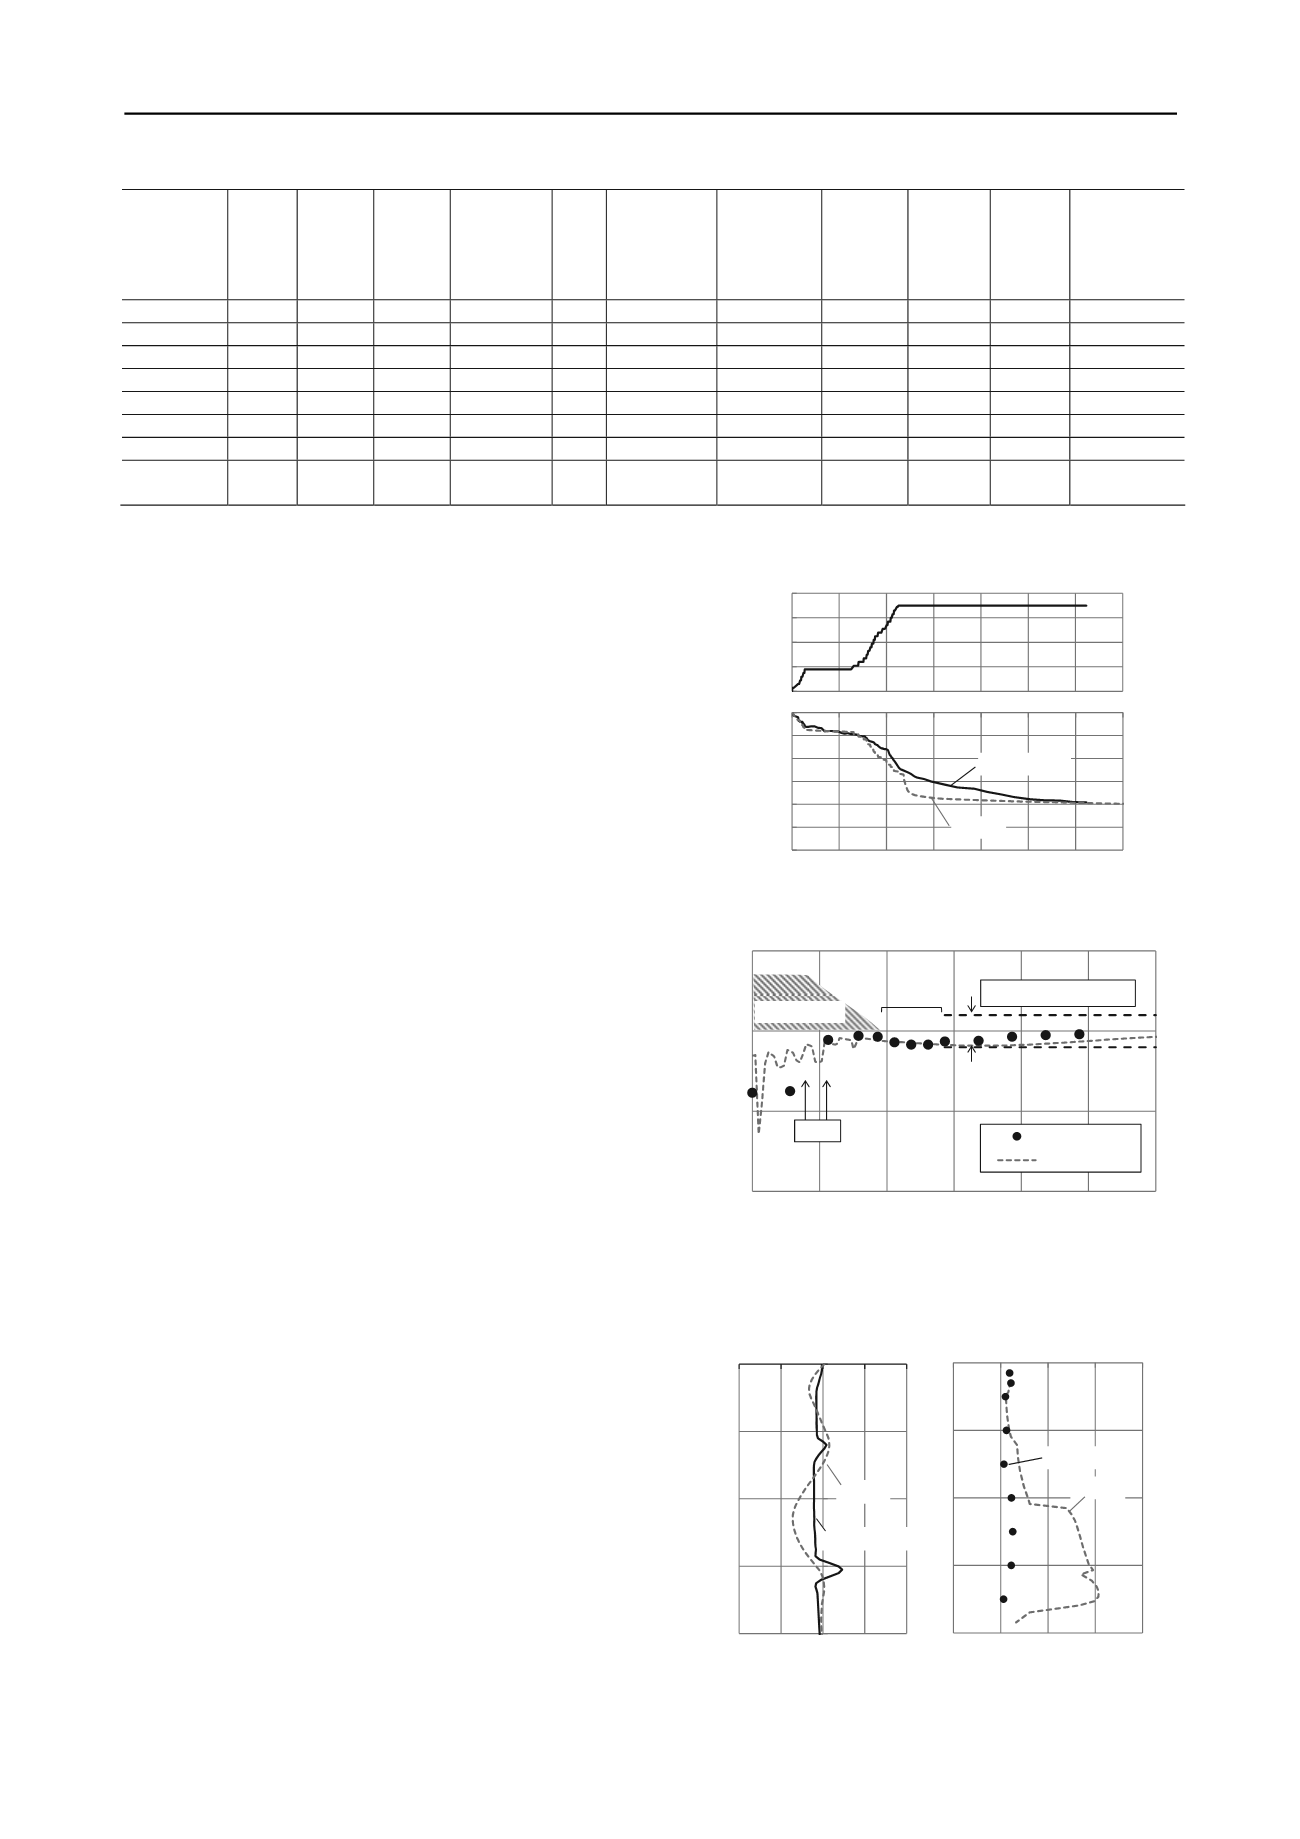
The following figures are for the sake of comparison and
analysis: Figure 6 shows the history of ground-surface
settlement at the center of the embankment; Fig.7 shows the
distribution of ground-surface settlement after construction of
the embankment; Fig. 8 shows the horizontal displacement and
vertical strain of the walls. The settlement history and
displacement of the ground surface and walls are quantitatively
evaluated using two-dimensional analysis. However, a clear
difference in the vertical strain exists at greater depths. In the
numerical models, the deformation modulus of wallsless than 21
m in height is lower than that of walls greater than 21m in
heightas perthe arrangement of the deep mixing columns. This
is thought to be the cause of the difference in vertical strain.
Individual material propertiesare effective for evaluating the
strain distribution of walls.
4 DETERMINING THE OPTIMUM ARRANGEMENT OF
DEEP MIXING COLUMNS
In this method, the piles and walls are effectively arranged
according to the limit values of deformation in the embankment
and the adjacent area. Due to the countless combinations of
planar arrangements and improvement depths, arbitrary
parametric studies require considerable time to identify
optimum arrangement. Therefore,the following3-step method is
proposed fordetermining the optimum arrangement.
1) Determine the planar arrangement: First, walls are placed
in the ground under the edges of the embankment crown. Next,
inside and outside piles are arrangedequidistantly by an amount
not less than the necessary improvement ratio α, defined as
α=γ
H/
q
uck
(1)
0
2
4
6
8
0
50
100
150
200
250
300
0 100 200 300 400 500 600 700
Elapsed days (day)
Analysis
Measurement
Height of
Embankment (m)
Settlement of
Embankment (mm)
Figure 6.Settlement history of ground surface in center of the
embankment
‐100
0
100
200
0
10
20
30
40
50
6
Distance from center line of embankment (m)
0
Measurement
Analysis
Walls
Limit value
:±
20mm
Embankment
10m
Settlement after construction
of embankment (mm)
Figure 7.Distribution of ground surface settlement after construction of
the embankment
‐40
‐30
‐20
‐10
0
‐40 ‐20 0 20 40
Depth (m)
Analysis
Measurement
(a)
Horizontal displacement of walls after
construction of embankment (mm)
‐1500
‐1000
‐500
0
500
Analysis
Measurement
(b)
Vertical strain of walls after
construction of embankment (με)
Figure 8.(a) Horizontal displacement of walls (b) Vertical strain
in walls


