2539
Technical Committee 211 /
Comité technique 211
A total of 28 numbers of M-GTs were instrumented and
monitoring at various stages of the installation process. One of
the key parameters was that monitored closely is the strain
development of the M-GT at different stages. The results of the
monitoring during the installation process were presented by
Chew et al. (2011) and it showed that high tensile forces of
about 180kN/m were recorded at the bottom of M-GT during
the impact onto the seabed.
Hydrographic survey was used to monitor the shape of the
installed M-GTs, which is one of the performance indicators of
this design. The accuracy of the installation was determined by
using survey results conducted before and after the dumping of
the instrumented M-GTs. The overall construction progress of
the bund was also tracked using hydrographic surveys that were
conducted every 5 days. The profile of the bund can be plotted
using the survey results as shown in Figure 5, which shows one
of the completed bund.
Figure 5 Profile of completed bund 1
After the completion of the bund, a total of 11 instrument
clusters have been installed to monitor the performance of the
containment bund during other construction activities such as
the filling of dredged soil behind the containment bund and soil
improvement works for the dumped material within the
containment bund.
Out of the 11 instrumented clusters, 6 of them were placed at
the top of the bund and the remaining was installed to monitor
the slope of the bund by using a staging. The cross section of
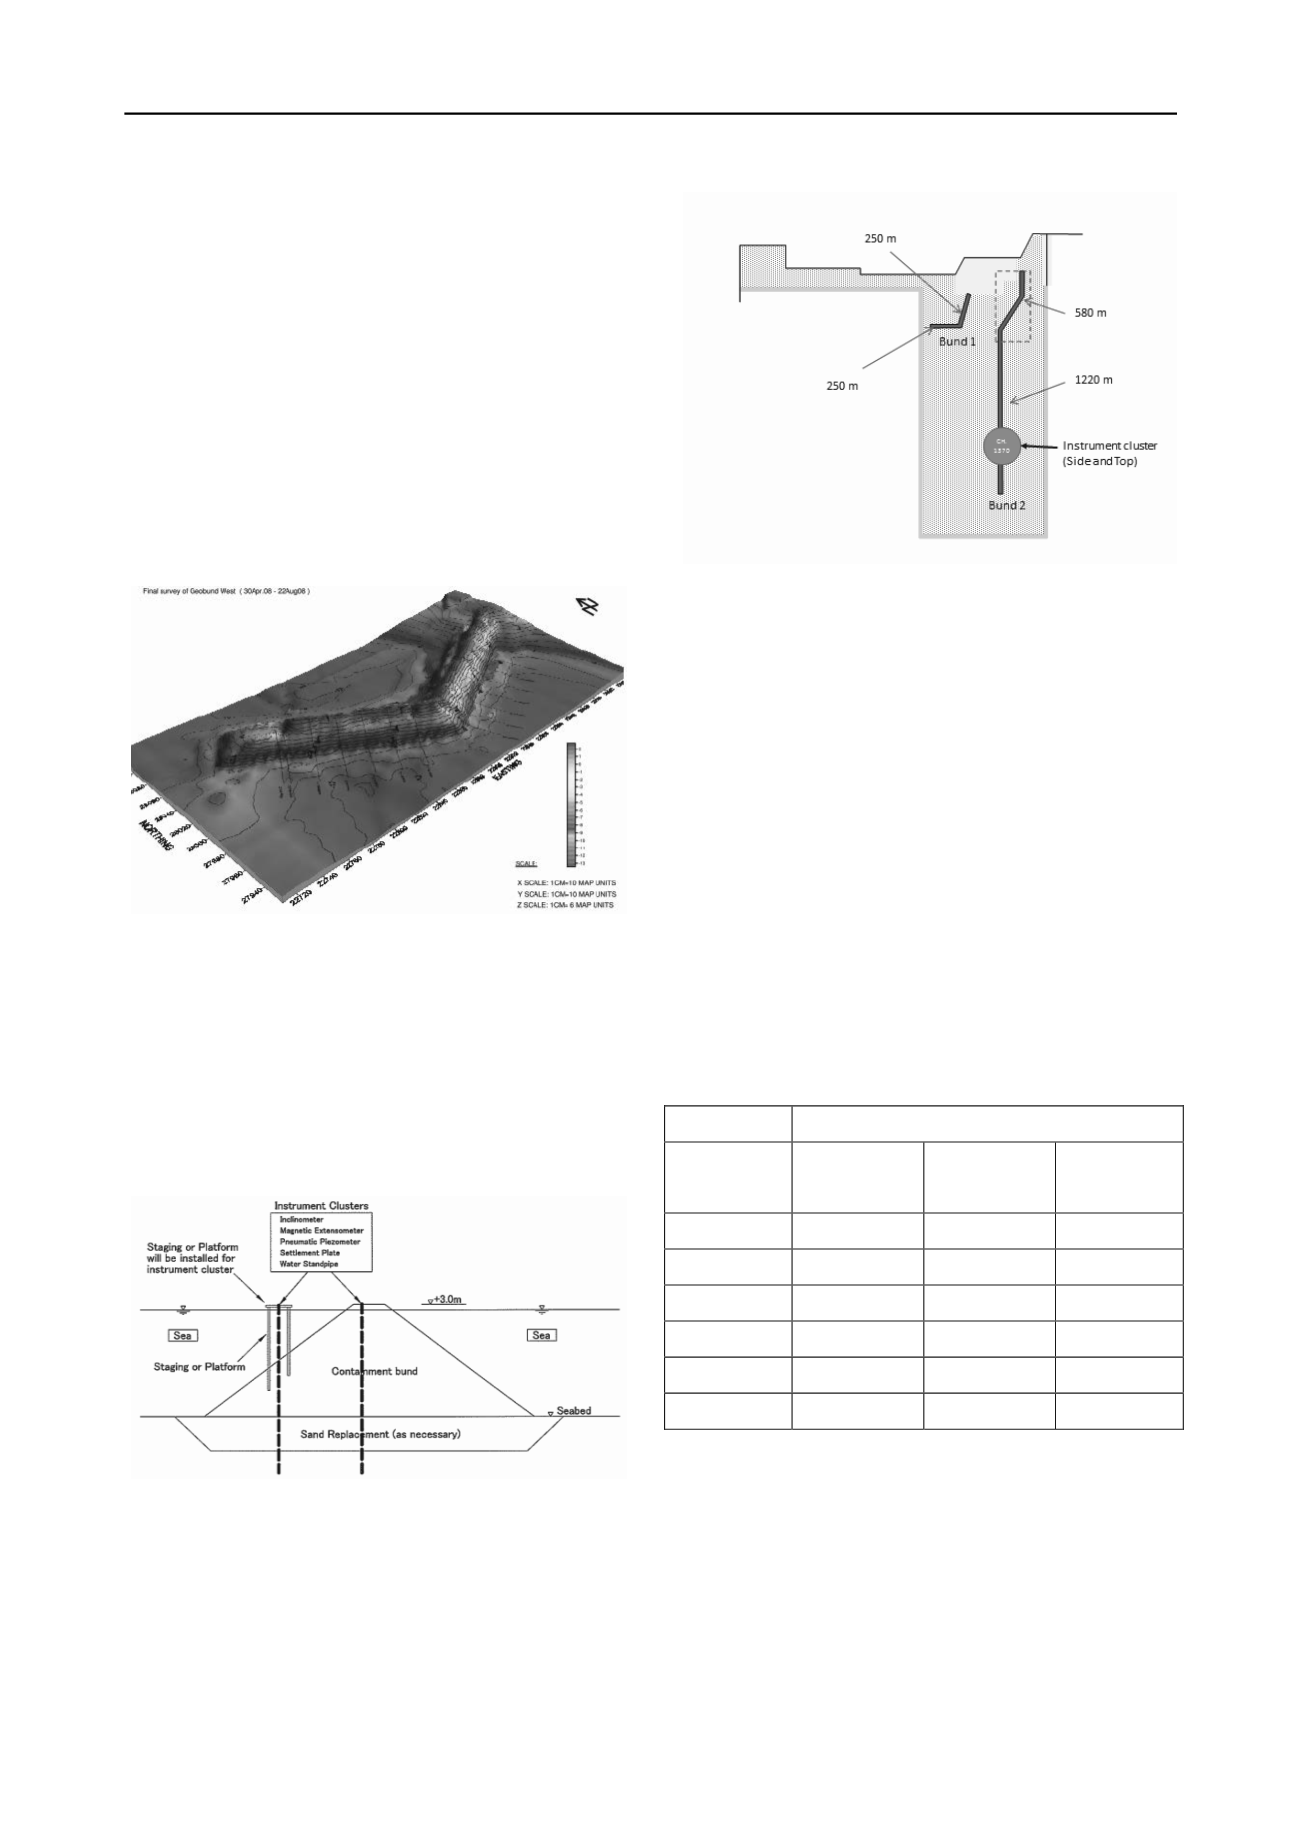
the instrument clusters is given in Figure 6.
Figure 6 Instrumentation cluster installed in the containment bund
The results from the inclinometers installed at the top and
side faces of the bund are discussed here. The location of the
inclinometer is at CH. 1370 (Figure 7). The lateral deformation
in the section perpendicular to the centre line of the bund is
plotted in Figure 8 for both top and side inclinometer.
Figure 7 Location of inclinometers at CH. 1370 of the bund (Plan view)
The inclinometer readings show that the maximum
deformation of the bund centre is 10mm at elevation of -8.5m
(Figure 8a). The measurement was taken at 911 days after the
completion of the bund at that location. This shows that the
containment bund has remained stable throughout the period of
other construction activities that occurred during this period.
Figure 8b shows the lateral deformation at the sides of the
bund, which was also found to be within 10mm, where the
maximum deflection occurred close to the bottom of the bund.
Higher lateral deformation of up to 30mm was also recorded by
the inclinometer at elevation above the bund (i.e. -5m to +10m).
The lateral movement above the surface of the bund (side
inclinometer) indicates that the dredged filled material has been
placed onto the sides of the bund and at the same time being
treated.
The settlement measured by extensometers installed on the
top and side instrumentation clusters and settlement plates at the
top of the bund are given in Table 1. The settlement readings
showed that the geotextile containment bund filled with cement
mixed soil has remained stable and performed as expected
throughout the construction period of this project.
Table 1 Settlement of containment bund
Settlement (mm)
Elevation
Extensometer
(Center)
Extensometer
(Side)
Settlement
plate
Top
‐‐‐
‐‐‐
11
‐3.0 CD
24
‐‐‐
‐‐‐
‐6.0 CD
26
40
‐‐‐
‐9.0 CD
25
29
‐‐‐
‐12.0 CD
17
23
‐‐‐
‐15.0 CD
18
8
‐‐‐


