2531
Technical Committee 211 /
Comité technique 211
void ratio reduction (
Δe
) due to the disturbance can be
evaluated from the liquid limit and the natural water content.
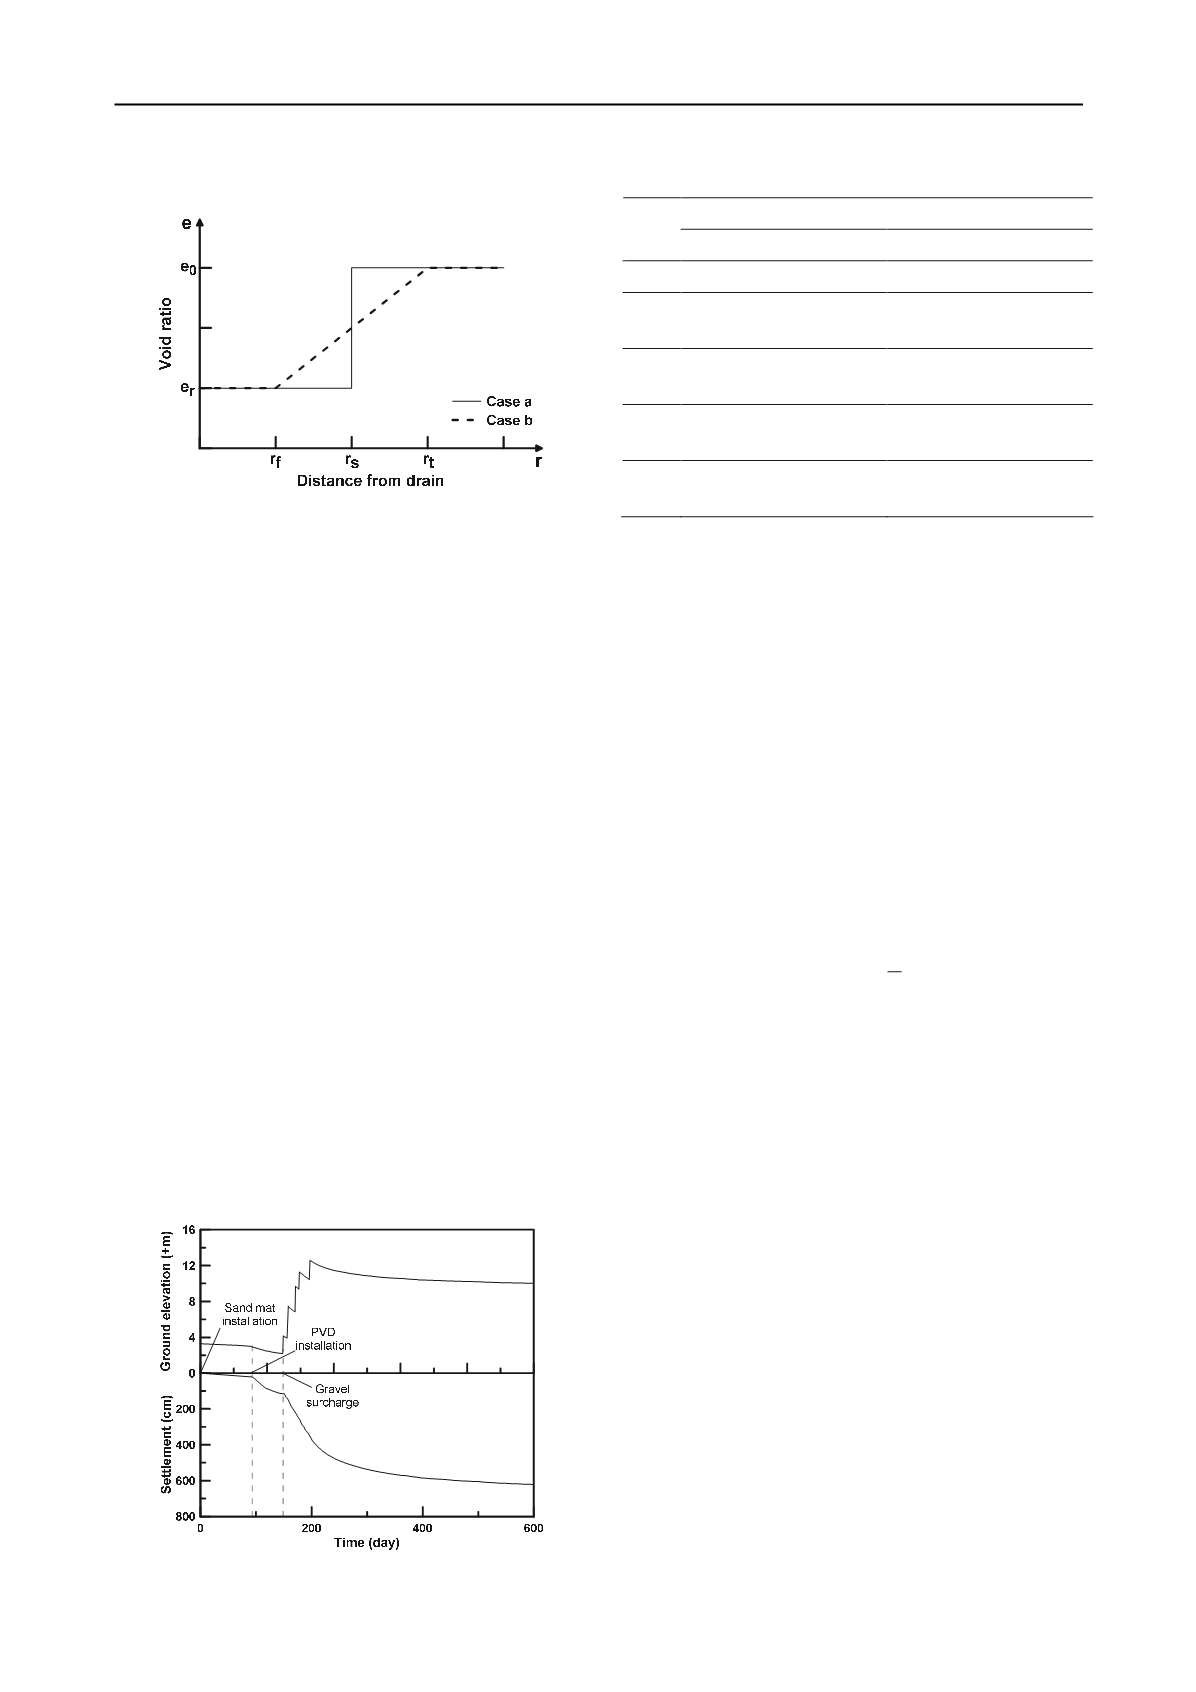
figure 3. Variations of void ratio in disturbed zone
figure 3 shows two possible variations of the void ratio with
radial distance from the center of the drain. case a assumes a
constant permeability or void ratio within the disturbed zone
(r
s
). however, most studies (onoue et al. 1991, indraratna and
redana 1998, shin et al. 2009) were consistently insisted a
decrease in the permeability or the void ratio within the
disturbed zone, although there are some differences in shape of
variation (e.g. linear, bilinear, and parabolic). to consider
variation of the permeability or the void ratio within the
disturbed zone, case b assumes that the void ratio linearly
increases from the value equal to e
r
at the outer boundary of the
fully disturbed zone (r
f
) to the initial void ratio (e
0
) of the
undisturbed soil at the outer boundary of the transition zone (r
t
).
for cases a and b, the volume changes due to the disturbance
induced by pVd installation can be expressed as:
a Case
e e H r
V
s
)
1/(
0
2
(4)
b Case
e e H r r r
r
V
t
t
f
f
)
1/(
]3/)
[(
0
2
2
(5)
where, Δe is the void ratio reduction due to the disturbance, and
h is the thickness of the target clay layer.
figure 4 shows the ground elevation and total ground
settlement during the entire period of the improvement. the
measured settlement that occurred between the pVd installation
and surcharge loading is 85.6 cm. this ground settlement could
be occurred by the two reasons: 1) void ratio reduction within
the disturbed zone; and 2) consolidation settlement in the
undisturbed zone due to the sand mat. the consolidation
settlement in the undisturbed zone is calculated as 13.8 cm by
using Zeng and Xie's solution (1989). therefore, the ground
settlement caused by the void reduction within the disturbed
zone is 71.8 cm.
figure 4. Ground level and settlement of Busan new-port site
table 2. analysis conditions
analytical condition
case
hansbo
’
s method
proposed method
1
no disturbance, c
h
= c
v
no disturbance, c
h
= c
v
2
c
h
= c
v
in disturbed zone,
c
h
= 2c
v
in undisturbed zone
no disturbance, c
h
= c
hs
3
c
h
= c
v
in undisturbed zone,
k
h
/k
s
= 2.5
c
h
= c
hs
in disturbed zone,
k
h
/k
s
or k
h
/k
f
= 2.5
4
c
h
= c
v
in undisturbed zone,
k
h
/k
s
= 5.0
c
h
= c
hs
in disturbed zone,
k
h
/k
s
or k
h
/k
f
= 5.0
5
c
h
= c
v
in undisturbed zone,
k
h
/k
s
= 10.0
c
h
= c
hs
in disturbed zone,
k
h
/k
s
or k
h
/k
f
= 10.0
the extent of the disturbed zone (r
s
) for case a is easily
calculated as 21.6 cm based on 71.8 cm of the ground
settlement. however, it is hard to calculate the values of r
f
and r
t
for case b because both r
f
and r
t
values are variables. for the
linear spatial variation, previous studies suggested that the r
f
is
approximately 1.0~1.6r
m
(onoue et al. 1991, hird and moseley
2000, sharma and Xiao 2000), where r
m
is the equivalent radius
of the mandrel. in this study, since the r
f
is assumed to be 1.0r
m
(8.0 cm), calculated value of r
t
is 4.1r
m
.
3.4
Consolidation analysis
the consolidation rate of Busan new-port is predicted using
both hans
bo’
s method and proposed method. to evaluate effect
of consolidation properties, parametric study is performed for a
set of different conditions, as shown in table 2. in case of
proposed method, two possible permeability variations within
disturbed zone are considered. Based on the pVd property,
d
w
=6, d
e
=135cm, and q
w
=15cm
3
/sec are used for analysis.
figure 5 shows the rate of consolidation settlement predicted
by both hansbo's method and proposed method, and the
measured settlement for the layer located above el -30 m. the
average degree of consolidation (
U
) is calculated by using
carillo's suggestion (1942), and then the consolidation
settlement is calculated by considering the non-linear
relationship between the consolidation settlement and the
degree of consolidation.
as shown in figure 5(a), hansbo's analysis for cases 1 and 2
overestimate the settlement rate compared with the measured
one because the coefficient of horizontal consolidation in the
disturbed zone is assumed to be the same as c
v
. all cases do not
fit well with the measured settlement. to obtain the best result
by hansbo's analysis, it is necessary to know proper values of c
h
and k
h
/k
s
. however, the suitable k
h
/k
s
ratio appears to vary with
the assumed c
h
value.
proposed analysis (case a) results show in figure 5(b). the
settlement rate at a certain time is underestimated to compare
with the measured settlement, since the extent of disturbed zone
is evaluated relatively large compared with the real condition
due to an assumption for a constant permeability or void ratio
within the disturbed zone. Basu et al. (2006) suggested the
simplified µ
s
for the linear spatial variation in disturbed zone
(case b). Using this suggestion, the settlement rate for case b is
calculated by the proposed method, as shown in figure 5(c).
case 4 (k
h
/k
f
= 5.0) is well matched with measured settlement
within 100 days, and then case 3 (k
h
/k
f
= 2.5) shows good
agreement with the measured settlement after 100 days. since
the typical value of c
h
/c
v
could be larger than 1.0 in nature, the
k
h
/k
f
is presumed larger than 3.0, based on the consolidation test
results. the slightly underestimation of the settlement rate
predicted with the presumed k
h
/k
f
value may occur due to the
difference in the surcharge schedule. in the analytical solution,


